![Studied oil samples and their viscosities. Compiled from Rakhmatullin et al[46].](/storage/images/resized/y6CaWUlrWqcWApJw6LZYiYc71ycs0m8s3gHzks3e_xl.webp)
![Edited HSQC spectrum (CH2 groups are in red; CH and CH3 groups are in blue) of a representative light coker naphtha sample in CDCl3. Designation of regions are provided in Table 4. Reproduced from Mondal et al.[34] with the permission of the American Chemical Society](/storage/images/resized/9NeHH8yLr8XRO7EfK7XHrow0zLiuloMQ8vvXmws3_xl.webp)
Keywords
Abstract
Present review covers the most recent advances in the NMR studies of oil refining products - light fractions, different types of fuels, heavy fractions, and crude oil itself. By no means does it discuss NMR applications in this field in detail providing only a brief overview of different NMR methods used for structural elucidation of the oil refining products together with crude oil with particular emphasis on recent achievements and advances in this field.
The bibliography includes 48 references.
1. Introduction
A breakthrough in the NMR studies of oil and oil refining products including light fractions, different types of fuels, heavy fractions, and crude oil itself provides a comprehensive structural elucidation of oil and oil refining products. The reviewed recent achievements and advances in this field are on the cutting edge of the modern oil refining chemistry and petrochemical industry.
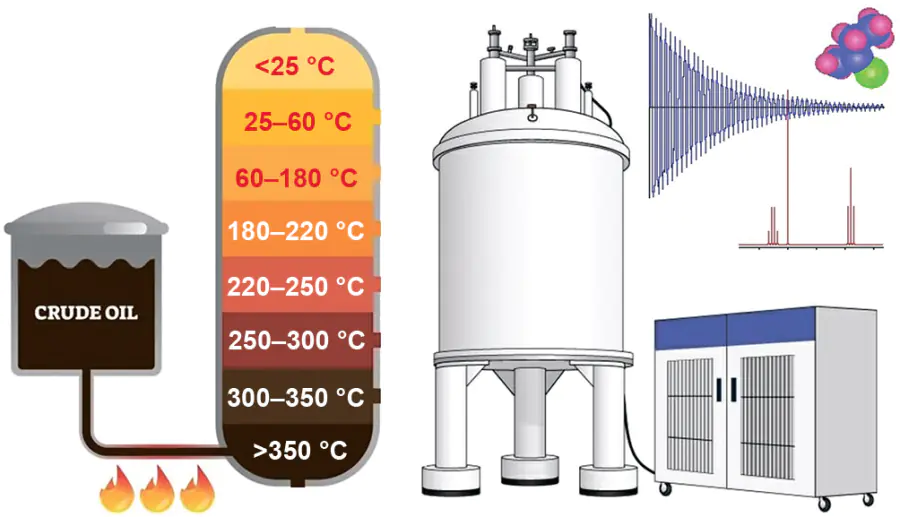
Applications of experimental 1H and 13C NMR spectroscopy to the analysis of fuel in petroleum industry and oil refining technology are well covered in a number of reviews including that by Edwards[1]. Those studies are unfolding in parallel with significant progress in the computational NMR of hydrogen[2-4], and carbon[5-10]. The present review discasses the recent advances in the NMR applications to the oil refining products, light fractions, various types of fuels, heavy fractions, and crude oil, as schematically shown in Figure 1.
![[{"id":"36ZgDV2YLv","type":"paragraph","data":{"text":"Basic types of fuel in the oil fractional distillation process. Reproduced with minor editing privilege from https://www.123rf. com/photo_150445606_fractional-distillation-of-crude-oil-labelededucational-explanation-scheme-diagram-with-chemical.html."}}]](/storage/images/resized/gNpR3mXkGzFYN4sNeD6Z8BL7PeW5LGPNrKj3MrGP_xl.webp)
Generally, there is an overwhelming amount of publications dealing with application of NMR techniques to the structural elucidation of gasoline[11-17], diesel[18-22], kerosene[23-26], distillate fractions[27, 28], and crude petroleum (see historical reference[29]) together with some other oil refining products. In the present brief review, we will by no means attempt to discuss in detail the application of NMR in this area. This review is only an overview of various NMR methods used for the structural elucidation of various oil refining products together with crude oil itself with particular emphasis on recent achievements and advances in this field.
1H and 13C NMR is also used in the fuel industry to estimate reservoir properties such as porosity, permeability, wettability, irreducible water saturation, and irreducible oil saturation[30]. In fact, the exploration and production of oil have essentially benefited from the application of NMR by effectively studying the evaluation of fuel properties.
Broadly speaking, typical 1H and 13C NMR chemical shift ranges of functional groups defining the composition of oil samples and their distillation products are given accordingly, in Table 1 and Table 2.
![Typical ranges of <sup>1</sup>H NMR chemical shifts of functional groups defining the composition of oil samples. Compiled from Kalabin, Kanitskaya, and Kushnarev[<a class="anchor" href="#reference-5868" id="mention-reference-5868">31</a>].](/storage/images/resized/jXKHQq17wZz0Rfdaf1z0FTvAhsScUyOImXxHenUU_xl.webp)
![Typical ranges of <sup>13</sup>C NMR chemical shifts of functional groups defining the composition of oil samples. Compiled from Kushnarev et al[<a class="anchor" href="#reference-5869" id="mention-reference-5869">32</a>].](/storage/images/resized/SR5cuZ6D7mugMU92xpNc5JcjVq2dW9UNlEfiUMbq_xl.webp)
2. NMR of fuel: recent advances and perspectives
2.1. Light fractions
Historically, Mühl and Srića[13] were the first to determine gasoline octane number by means of 1H NMR, which is exemplified with a spectrum presented in Figure 2. In this paper, the correlation between octane number and the fluid catalytic cracking gasoline chemical composition was established according to the standard engine method and further tested by applying a linear regression analysis.
A decade or so later Meusenger[12] reported that 1H NMR allowed a rapid and accurate quantitative determination of the composition and quality of various gasolines. For this study, about 140 gasolines from Austrian filling stations were analyzed and the amounts of methanol, methyl t-butyl ether, and benzene together with other aromatic compounds were determined quantitatively using an internal standard.
![[{"id":"mnFA5PONgN","type":"paragraph","data":{"text":"The 90 MHz <sup>1</sup>H NMR spectrum of a neat fluid catalytic cracking gasoline. Reproduced from Mühl and Srića[[ type=\"anchor\" referenceId=\"5850\" ]] with the permission of Elsevier."}}]](/storage/images/resized/VQqNPrYS5E4iCvxFHuy9eFIlh0OW3TRADdtyAUJ5_xl.webp)
Figure 3 shows a typical 1H NMR spectrum of unleaded EuroSuper gasoline in CDCl3. The chemical shift scale was divided by the author into 12 regions, marked A to M, as shown in this figure. The regions A, D, and E are magnified for clarity. The signals in the chemical shift region between 4.6 and 6 ppm, connected with the protons bonded to unsaturated carbons in olefins, were divided into five substructure groups (from D1 to D5). The small signal at 3.42 ppm (E, methyl protons of methanol) is in the range of the 13C satellites of the methyl t-butyl ether signal (3.37 ppm). A more detail specification of A to M ranges is given in Table 3.
![<sup>1</sup>H NMR chemical shifts of structural fragments of gasolines. Compiled from Meusenger[<a class="anchor" href="#reference-5849">12</a>].](/storage/images/resized/R6v0Di52lyJPeDbPNsbaHWXv4KTUEcDWmsd3Cxwp_xl.webp)
![[{"id":"gPpq7YzgN6","type":"paragraph","data":{"text":"The <sup>1</sup>H NMR spectrum of a typical neat EuroSuper gasoline sample. The regions A to M are specified in the spectrum, and regions A, D and E are zoomed vertically by a factor of 80. Reproduced from Meusenger[[ type=\"anchor\" referenceId=\"5849\" ]] with the permission of Elsevier."}}]](/storage/images/resized/yPtsDhh1IuVHT7gpnzI8r7aWV26Y3O6oGcnq8OJt_xl.webp)
Kapur, Singh, and Sarpal[15] developed a quantitative 1H NMR-based method for determining the composition of aromatics, naphthenes, and paraffins of straight-run gasoline fractions. In this paper the authors derived the equations necessary to calculate these compounds from the overlapped 1H NMR spectra with particular emphasis on signals from naphthenes and isoparaffins.
Figure 4 shows a typical 1H NMR spectrum of the straight-run petroleum cut. In this spectrum, region A is characteristic of aromatics, while signals due to the α-substituents appear in regions B and C. The region between 0.5 and 2.05 ppm is highly overlapped and contains signals mainly of cycloalkanes (naphthenes), normal and isoparaffins. The regions 0.5 – 1.0 ppm (H) and 1.0 – 1.4 ppm (G) are due to the CH3 and CH2 groups, respectively. Figure 5 and Figure 6 show 1H NMR spectrum of the standard naphthene and isoparaffin mixtures consisting of different types of cycloalkane molecules with boiling points in the gasoline range.
![[{"id":"F6rll8B9-5","type":"paragraph","data":{"text":"The 300 MHz <sup>1</sup>H NMR spectrum of a representative straight-run gasoline fraction in CDCl<sub>3</sub>. Reproduced from Kapur et al.[[ type=\"anchor\" referenceId=\"5852\" ]] with the permission of Elsevier."}}]](/storage/images/resized/qTBP2by89yVZOX7orSQxBey4JnvrwCsJPs5xn1TX_xl.webp)
![[{"id":"4OaNS5EMrb","type":"paragraph","data":{"text":"The 300 MHz <sup>1</sup>H NMR spectrum of a standard naphthene mixture in CDCl<sub>3</sub>. Reproduced from Kapur et al.[[ type=\"anchor\" referenceId=\"5852\" ]] with the permission of Elsevier."}}]](/storage/images/resized/njBHgYFDAwc9hReVC74xdEUgP0tq85G9bRBKPAit_xl.webp)
![[{"id":"kQfqOeHJT2","type":"paragraph","data":{"text":"The 300 MHz <sup>1</sup>H NMR spectrum of a standard isoparaffin mixture in CDCl<sub>3</sub>. Reproduced from Kapur et al.[[ type=\"anchor\" referenceId=\"5852\" ]] with the permission of Elsevier"}}]](/storage/images/resized/EeQey1GEqXae6MvedwrP7xZE8aaCW06Ekxxr2R3j_xl.webp)
In a later paper by the same principal authors[33], the developing of a direct and fast method based on the 1H NMR spectroscopy for determining paraffins (P), olefins (O), naphthenes (N) and aromatics (A), abbreviated as ‘PONA’ was reported. Using this method, the composition of fluid catalytic cracking gasoline and coker gasoline containing olefinic hydrocarbons was established, as illustrated in Figure 7 and Figure 8. The analysis performed showed that the PONA content of the fluid catalytic cracking gasoline and coker gasoline samples could be easily estimated using NMR spectral integral data without the use of standards. The method was announced to be convenient, accurate, and less time-consuming than gas chromatography and mass spectrometry used for the same purpose.
![[{"id":"xgkw0NGkWO","type":"paragraph","data":{"text":"The 300 MHz <sup>1</sup>H NMR spectra in CDCl<sub>3</sub> of (a) straightrun naphtha; (b) fluid catalytic cracking gasoline; (c) coker gasoline. Reproduced from Sarpal <i>et al.</i>[[ type=\"anchor\" referenceId=\"5870\" ]] with the permission of Elsevier."}}]](/storage/images/resized/WW4HXLMs5JQJfec9Prx3DUpdzZvRRxr1czVecu8I_xl.webp)
Jameel et al.[16] suggested an improved model for the prediction of ignition quality of hydrocarbon fuels by means of 1H NMR using a calibration set of cetane numbers of pure hydrocarbons and hydrocarbon blends of known composition by applying multiple linear regression modeling. In this study, a particular emphasis was placed on the effect of branching, and a new parameter denoted as the ‘Branching Index’ was introduced to quantify this effect in the series of 71 pure hydrocarbons and 54 hydrocarbon blends. The developed model was validated with experimentally measured cetane numbers of 22 real gasolines and 59 blends of known composition, and predicted values were found to match well with experimental data.
![[{"id":"kn4JAldb5s","type":"paragraph","data":{"text":"Olefinic region of 300 MHz <sup>1</sup>H NMR spectra in CDCl<sub>3</sub> of (a) fluid catalytic cracking gasoline; (b) coker gasoline. Reproduced from Sarpal <i>et al</i>.[[ type=\"anchor\" referenceId=\"5870\" ]] with the permission of Elsevier."}}]](/storage/images/resized/MrBOFvOdSxTpam2VQX0ncDafSQgFXU05JJKDy7ee_xl.webp)
Later the same lead authors[17] presented a novel approach to surrogate fuel by minimizing the number of surrogate species. Five key functional groups, namely paraffinic CH3, CH2, and CH, naphthenic CH – CH2, and aromatic C – CH groups, as well as structural information provided by the Branching Index, were chosen as matching targets. At that, six models of FACE (Fuels for Advanced Combustion Engines) gasoline target fuels were established. As a result of that study, five abovementioned functional groups of those fuels were qualitatively and quantitatively identified using high-resolution 1H NMR spectroscopy, as illustrated by the 1H NMR spectra of the model FACE gasoline fuels shown in Figure 9, where the Branching Index for each surrogate molecule is provided in parenthesis.
![[{"id":"mDOREJBmNt","type":"paragraph","data":{"text":"700 MHz <sup>1</sup>H NMR spectra of the model FACE gasoline fuels in CDCl<sub>3</sub>. Reproduced with minor editing privilege from Jameel <i>et al.</i>[[ type=\"anchor\" referenceId=\"5854\" ]] with the permission of Elsevier."}}]](/storage/images/resized/BB0BlEJfyY7BsR5Du0dZyFxvGnY43Ygq08dZ7Zov_xl.webp)
In a very recent study Mondal and coauthors[34] proposed a powerful method for the accurate determination of various kinds of quaternary, methine, methylene, and methyl carbons in the light coker naphthas by means of the two-dimensional phase-sensitive gradient-selected edited Heteronuclear Single Quantum Coherence (known as ‘edited HSQC’), as illustrated in Figure 10. The typical ranges of the 1H NMR chemical shifts of the functional groups defining the composition of light coker naphthas are given in Table 4.
![Typical ranges of 1H NMR chemical shifts of the functional groups defining the composition of light coker naphthas. Compiled from Mondal et al[<a class="anchor" href="#reference-5871">34</a>].](/storage/images/resized/Vcd7mGHFtQCjdanh1a5792S7d2pgvtNFG2QytoqM_xl.webp)
Comparison of these results with two standard chromatography-based methods for PONA estimation showed that the proposed method gave excellent correlations for the estimation of olefins and aromatics and, but relatively poor correlation for naphthenes. However, the authors stated, that this NMR method for PONA estimation is ‘rapid, free from manual error, highly repeatable, and best suitable for monitoring pilot plant reactions with high sample throughput’[34].
Another example is the identification of conjugated diolefins made possible by the two-dimensional NMR experiments where the olefin resonances could not reveal the presence of protons adjacent to each other on conjugated olefin double bonds[1]. An example of the 1H – 1H COSY (COrrelated SpectroscopY) result obtained on a coker naphtha is shown in Figure 11, taken from this publication. It can be seen that correlation of olefinic protons with adjacent olefinic and aromatic protons provides a distribution of conjugated diolefins which can then be quantified in the 1-dimensional NMR spectrum.
![[{"id":"GKmr9ijZWI","type":"paragraph","data":{"text":"<sup>1</sup>H–<sup>1</sup>H COSY of a coker naphtha stream in CDCl<sub>3</sub>. Reproduced with minor editing privilege from Edwards[[ type=\"anchor\" referenceId=\"5838\" ]] with the permission of ASTM International."}}]](/storage/images/resized/unJW9eBwSH3rVG0fK8KrSYmbswoc9YPLBWjojjwF_xl.webp)
It is well known that the low magnetic fields permanent magnets are characterized by the high basic field homogeneity and tight magnet temperature control. Mechanical and electrical shim systems provide the high resolution NMR data at low magnetic fields. A typical 1H NMR spectrum of a gasoline product obtained on such spectrometers is shown in Figure 12[1].
![[{"id":"djbTQhb2_-","type":"paragraph","data":{"text":"The 60 MHz <sup>1</sup>H NMR spectrum of a neat gasoline obtained on a process NMR unit. Reproduced with minor editing privilege from Edwards[[ type=\"anchor\" referenceId=\"5838\" ]] with the permission of ASTM International."}}]](/storage/images/resized/nanfNtG1lAzCZa4iDnNb15F0aKtth38bjGu6sBG3_xl.webp)
Light naphtha is a mixture consisting mainly of straight-chained and cyclic aliphatic hydrocarbons having from five to six carbon atoms per molecule, while heavy naphtha possess from seven to nine carbon atoms per molecule. Low boiling light naphtha is generally a hydrocarbon product that is somewhat interchangeable with natural gasoline and lease condensates. Although low boiling naphtha has properties similar to lease condensate and natural gasoline, it is considered to be a refined product since it is produced by refinery distillation or the process of condensate splitting. In fact, most naphthas are produced from crude oil in the first step of the refining process, distillation. Light naphtha is composed predominantly of pentane and hexane derivatives as well as smaller amounts of higher molecular weight hydrocarbons.
The 1H NMR spectroscopy has been widely used for the structural elucidation of naphthas. Much structural information is provided by the 1H NMR spectra of naphthas recorded at the frequencies of 400 MHz and higher. Below are a few examples of the 1H NMR spectra of different naphthas (Light Naphthas, Straight-Run Naphthas, and Coker Naphthas) recorded at 400 MHz presented accordingly, in Figure 13 – Figure 15.
![[{"id":"ukJz1DNSu_","type":"paragraph","data":{"text":"The typical 400 MHz <sup>1</sup>H NMR spectrum of neat light naphtha. Reproduced with minor editing privilege from https://process-nmr.com/naphtha-analysisby-nmr/(Process NMR Associates) under the CC BY-NC 4.0 International Public License."}}]](/storage/images/resized/xxncVOxWKcu7HBIzX71s56jIxsIvaD2DKSJvgLQn_xl.webp)
![[{"id":"PukZpDr3NZ","type":"paragraph","data":{"text":"The typical 400 MHz <sup>1</sup>H NMR spectrum of neat straight-run naphtha. Reproduced with minor editing privilege from https://process-nmr.com/naphtha-analysisby-nmr/(Process NMR Associates) under the CC BY-NC 4.0 International Public License."}}]](/storage/images/resized/OOkqc62t2yPOASF5pLQFINOqScjNORQirDT1dFpU_xl.webp)
![[{"id":"p5NZPwEVFm","type":"paragraph","data":{"text":"The typical 400 MHz <sup>1</sup>H NMR spectrum of neat coker naphtha. Reproduced with minor editing privilege from https://process-nmr.com/naphtha-analysisby-nmr/ (Process NMR Associates) under the CC BY-NC 4.0 International Public License."}}]](/storage/images/resized/com8utUo4vzfqetMn2XQwCAbvf72xIkA5mEDVLU9_xl.webp)
2.2. Fuels
To compare the higher resolution of 1H NMR experiments performed on superconducting NMR systems with those carried out on 60 MHz spectrometers, characteristic spectra of a diesel fuel recorded at 60 and 300 MHz are presented in Figure 16. Although more peaks are resolved at 300 MHz, the overall chemical information obtained from these two NMR spectra seems to be the same. In most cases NMR spectrometers with field strengths of 7 – 11.7 Tesla (corresponding to the 1H resonance frequencies of 300 – 500 MHz) are adequate for the liquid-phase petroleum applications, as the higher resolution at higher magnetic fields does not provide any extra chemical information.
![[{"id":"bc0Twi8x0P","type":"paragraph","data":{"text":"<sup>1</sup>H NMR spectrum of neat diesel fuel at different resonance frequencies. Reproduced with minor editing privilege from Edwards[[ type=\"anchor\" referenceId=\"5838\" ]] with the permission of ASTM International."}}]](/storage/images/resized/GvxWyucgdPO5LJXh4subPIaQtfwa0YGX0HOel8On_xl.webp)
Some examples of 13C NMR spectra of diesel fuels taken from Edwards 1 are shown in Figure 17. In these spectra, cracked diesel shows the presence of olefinic carbon, straight-run diesel shows a narrow distribution of aromatics, while naphthenic diesel displays a typical ‘hump’ in the aliphatic carbon region, which can be attributed to the fraction of naphthenic and paraffinic carbons.
![[{"id":"X38js6AeBo","type":"paragraph","data":{"text":"Quantitative <sup>13</sup>C NMR spectra of three neat diesel fuels from different refinery processes. Reproduced with minor editing privilege from Edwards[[ type=\"anchor\" referenceId=\"5838\" ]] with the permission of ASTM International."}}]](/storage/images/resized/C60XurPV44rXn1dj8YI3NpfIcgxHkzyTwq8z16DR_xl.webp)
It is well known that the Distortionless Enhancement by Polarization Transfer (DEPT) technique allows the separate observation of methyl (CH3), methylene (CH2), methane (CH), and quaternary carbons of a petroleum product. For the oil refining products, this technique provides the analysis of hydrocarbon branching and calculation of aromatic ring system sizes. An example of a DEPT NMR spectrum of diesel fuel is shown in Figure 18 taken from Edwards.1 Further comparison of DEPT results with the quantitative 13C NMR single pulse excitation spectrum allows to identify and quantify the quaternary carbons. It also allows further calculation of the average aromatic ring size and other average molecule parameters describing the petroleum product, so that the entire refinery process can be analyzed and monitored.
![[{"id":"5S4aSnykGB","type":"paragraph","data":{"text":"<sup>1</sup>H–<sup>13</sup>C DEPT NMR of a neat diesel fuel showing the calculated subspectra for CH<sub>3</sub>, CH<sub>2</sub>, and CH carbons. Quaternary carbons are not observed in this experiment. Reproduced from Edwards[[ type=\"anchor\" referenceId=\"5838\" ]] with the permission of ASTM International."}}]](/storage/images/resized/ZTaPy8Z4u1S3TCrbnO9E0P17bjo06kMG9BNFEQZ7_xl.webp)
Important information can be obtained from the 13C NMR of diesel fuels, such as average chain length, alkyl substitution, aromatic carbon distribution, iso-paraffin content, and branching index. It is well known that (1) higher branching leads to lower oxidation stability; (2) increase in average alkyl chain length leads to increase in viscosity; (3) branching index and naphthenic content increase while normal paraffin content and aromatic content decrease; (4) decrease in aromatic carbon and increase in saturated carbon leads to increase in viscosity index during hydrogenation; (5) average chain length of paraffinic base oils decreases with hydrogenation[35].
13C NMR is uniquely suited to analyze branching structures of iso-paraffins. Approaches to their analysis include the use of DEPT experiments to identify either CH carbons at branching points or CH3 carbons whose chemical shift varies depending on the proximity of a molecule end or a branch point[1]. As an example, Figure 19 shows the peaks in the aliphatic region of the 13C NMR spectrum.
![[{"id":"2jw-XVgmXS","type":"paragraph","data":{"text":"Identification of peaks associated with various pendant and terminal methyl carbons in the aliphatic carbon region of the neat <sup>13</sup>C NMR spectrum. Also identified are the α, β, γ, δ, and ε resonances due to carbons in linear regions of a paraffin chain and the β' and γ' resonances which are methylenes two and three carbons away from a branch point. For used abbreviations, see original text. Reproduced from Edwards[[ type=\"anchor\" referenceId=\"5838\" ]] with the permission of ASTM International."}}]](/storage/images/resized/LpaUAfFa5MrV32mHhPy9ysRNRv6lVPk2ZyBKfa3Z_xl.webp)
Ure, O’Brayen, and Dooley[36] suggested a detailed experimental methodology for the measurement of quantitative 1H and 13C NMR spectra of liquid hydrocarbons. They determined optimal experimental conditions (pulse width, time delay, relaxant, solvent), which allowed the registration of the ‘entirely quantitative’ 1H and 13C NMR spectra of liquid hydrocarbons illustrated in Figure 20. The uncertainty associated with these measurements was generally found to be less than 3%; but this did not take into account overlapping peaks.
![[{"id":"zv3dFTvrdy","type":"paragraph","data":{"text":"(a) <sup>1</sup>H NMR spectrum of the Primary Reference Fuel «89», PRF89 (0.05 g) in CD<sub>2</sub>Cl<sub>2</sub> (1.0 g) at 400 MHz; (b) <sup>13</sup>C NMR spectrum of PRF89 (0.2 g) with 0.05 M Cr(acac)<sub>3</sub> in CDCl<sub>3</sub> (0.8 g) at 101 MHz; (c) <sup>1</sup>H NMR spectrum of the Toluene Reference Fuel, TRF (0.05 g) in CD<sub>2</sub>Cl<sub>2</sub> (1.0 g) at 400 MHz; (d) <sup>13</sup>C NMR spectrum of the TRF (0.2 g) with 0.05 M Cr(acac)<sub>3</sub> in CDCl<sub>3</sub> (0.8 g) at 101 MHz. Reproduced with minor editing privilege from Ure et al.[[ type=\"anchor\" referenceId=\"5873\" ]] with the permission of the American Chemical society"}}]](/storage/images/resized/5E6AYLKd2Th1S3Ll2cvEG0owZ1SA4on7wwLRyXtP_xl.webp)
In general, the use of the HSQC method allows the determination of the fuel-specific integral regions, and, most importantly, was shown to be a convenient method for the identification of overlapping peaks in the two-dimensional spectra, see Figure 21 and Figure 22. In particular, Region 1 in Figure 21 shows the overlap between the CH of iso-octane with three of the CH2 atom types in methylcyclohexane. Region 2 shows the overlap of the CH in methylcyclohexane, two of the CH2 atom types in methylcyclohexane, and all the CH2 atom types in n-decane. Region 3 shows overlap of a CH2 atom type from methylcyclohexane, the CH3 atom type from methylcyclohexane, and the CH3 atom type from n-decane. In general, the main purpose of this publication[36] was to experimentally determine and demonstrate the effective experimental conditions required to obtain quantitative 1H and 13C NMR results in typical liquid transportation fuels.
![[{"id":"m5hGOBFM9S","type":"paragraph","data":{"text":"(a) <sup>13</sup>C NMR spectrum of model fuel (0.2 g) with 0.05 M Cr(acac)<sub>3</sub> in CDCl<sub>3</sub> (0.8 g) at 101 MHz; (b) phaseedited HSQC spectrum of Model Fuel (0.05 g) in CD<sub>2</sub>Cl<sub>2</sub> (1.0 g) at 600 MHz. Reproduced with minor editing privilege from Ure <i>et al.</i>[[ type=\"anchor\" referenceId=\"5873\" ]] with the permission of the American Chemical Society."}}]](/storage/images/resized/bgdQ9JCaG4AJimSNUAFKpEJXBYodGEvTFrKziozB_xl.webp)
![[{"id":"uBOaa8hiX4","type":"paragraph","data":{"text":"Phase-edited HSQC spectrum of model fuel (0.05 g) in CD<sub>2</sub>Cl<sub>2</sub> (1.0 g) at 600 MHz. Reproduced from Ure <i>et al.</i>[[ type=\"anchor\" referenceId=\"5873\" ]] with the permission of the American Chemical Society."}}]](/storage/images/resized/sBqIbKploW72ARxr8tqPES4RExHieZ3hEQzlwoKV_xl.webp)
Jameel and coauthors[11] proposed using NMR spectroscopy in combination with Artificial Neural Networks (ANN) to predict the octane numbers of a range of FACE, namely the Research Octane Numbers (RON) and the Motor Octane Numbers (MON). The RON and MON are the two most commonly employed octane ratings for fuels used worldwide. In particular, RON is measured by running the fuel in a cooperative fuel research engine under standard test conditions followed by NMR monitoring.
In this paper, the effect of a number of functional groups including methyl, methylene, methyne, olefinic, naphthenic, and aromatic groups on the octane number of fuels was studied and some useful correlations were suggested. In particular, good correlations (R2 ≈ 0.99) were found between experimental and predicted values of RON and MON based on the comparison of 57 points randomly selected to validate this model for pure hydrocarbons together with hydrocarbon-ethanol and FACE gasoline-ethanol mixtures (see Figure 23).
![[{"id":"H-qRey4kF3","type":"paragraph","data":{"text":"Correlation plots of measured vs. predicted RON and MON values for the series of 57 points (in CDCl<sub>3</sub>), see text for details. Reproduced from Jameel <i>et al.</i>[[ type=\"anchor\" referenceId=\"5848\" ]] with the permission of the American Chemical Society."}}]](/storage/images/resized/goCSsHCB0KhPW0iYjB46euvtzdKNiFlPSKYLHfts_xl.webp)
2.3. Asphaltenes
In the crude oil production and processing, asphaltene aggregation and subsequent precipitation is a major problem for the oil industry leading to deactivation of catalysts, blocking pipelines, and deposition on the internal surface of the vessels. Asphaltenes, a complex natural mixture of compounds, consist of aromatic cores bonded to aliphatic and aromatic molecules containing heavy metals. NMR spectroscopy is largely used to characterize the chemical structure of asphaltenes and their chemical behavior, as recently reviewed by Ok and Mal[37].
Among many other related studies, Andrews and coworkers[38] performed a comparison of coal-derived and petroleum asphaltenes using 13C NMR, demonstrating that the molecular sizes of the coal-derived asphaltenes were substantially smaller than those of the original petroleum asphaltenes. It was found that interior bridgehead carbons were an important component of asphaltenes and that correct consideration of these carbons allowed the number of fused rings in the sample to be correctly determines. It was also established that the petroleum asphaltenes contained significantly more carbons in chains of at least 9 carbons in length than the coal-derived asphaltenes.
The average chain lengths derived by this method were relatively short, but this did not mean that the aliphatic chain lengths in petroleum asphaltenes were about 3 – 4 carbons long, as previously thought. The peaks labeled α, β, γ, δ, and ε in Figure 24 aroused from terminal carbons (α, 14 ppm), and carbons that were one (β, 22.7 ppm), two (γ, 32 ppm), three (δ, 29.7 ppm), four (ε, 30.1 ppm) or even more carbons away from the terminal carbon. Integration of those peaks yielded the number of carbons in the linear paraffins. In coals, these paraffins were found to be present at low levels (below 3%) and were relatively shorter and present in a wider range of chemical configurations than the petroleum asphaltenes. Naphthenic carbons and iso-paraffins accounted for the remaining saturated carbon intensity. On the contrary, petroleum asphaltenes were shown to have roughly 50% aromatic carbons, whereas in the coal-derived asphaltenes the contents of aromatic carbons was close to 80%, as can be easily established by 13C NMR (see Figure 25).
![[{"id":"Tj40MZlnu_","type":"paragraph","data":{"text":"Aliphatic portion of the <sup>13</sup>C NMR spectra for three neat coal-derived asphaltene samples (TH-A, WY-A, AD-A) and two petroleum asphaltenes (BG5, UG8). The peaks labeled α, β, γ, δ, and ε arise from terminal carbons (α, 14 ppm), and carbons that are one (β, 22.7 ppm), two (γ, 32 ppm), three (δ, 29.7 ppm), and four (ε, 30.1 ppm) or more carbons away from the terminal carbon. For used abbreviations, see original text. Reproduced with minor editing privilege from Andrews et al.[[ type=\"anchor\" referenceId=\"5875\" ]] with the permission of the American Chemical Society."}}]](/storage/images/resized/ocgDvbznWIm0SRNHkQKzaBEjEuvGX8TQGRqt7DMC_xl.webp)
![[{"id":"vReEODgbPD","type":"paragraph","data":{"text":"Aromatic part of the <sup>13</sup>C NMR spectra for three neat coal-derived asphaltenes (TH-A, AD-A, WY-A) and two petroleum asphaltenes (BG5, UG8). The petroleum asphaltenes have roughly 50% aromatic carbons, whereas the coal-derived asphaltenes are close to 80% aromatic carbons. For used abbreviations, see original text. Reproduced with minor editing privilege from Andrews et al.[[ type=\"anchor\" referenceId=\"5875\" ]] with the permission of the American Chemical Society."}}]](/storage/images/resized/knBHaHErzCVVIlinaK4luW6AFtmTlMQGeADqKha6_xl.webp)
Only protonated carbons were observed in the DEPT spectra of asphaltenes. To calculate the relative amount of paraffinic CH3 to aromatic CH and obtain a quantitative ratio, a simple ratio calculation was performed. This ratio was then applied to the quantitative 13C NMR data to subtract out the protonated aromatic carbons. Comparison with the signal intensities observed in the quantitative spin-echo experiments, allowed to the authors[38] to determine the amount of nonprotonated carbons presented in the aromatic region of the spectrum, as illustrated in Figure 26.
![[{"id":"hRQBuN4lBc","type":"paragraph","data":{"text":"Comparison of the normal quantitative <sup>13</sup>C SPE and DEPT45 spectra for the neat petroleum asphaltene sample UG8. Quantitative SPE underestimates the bridgehead carbon by 50–90%. Reproduced with minor editing privilege from Andrews <i>et al.</i>[[ type=\"anchor\" referenceId=\"5875\" ]] with the permission of the American Chemical Society."}}]](/storage/images/resized/wmBMvFVJ4f03NPwheImjrba0OcMoeDyoeFyehwns_xl.webp)
Later Fergoug and Bouhadda[39] examined structural parameters of asphaltenes derived from the Algerian Hassi Messaoud oil field by means of both 1H and 13C NMR. The main finding of this study was that the asphaltenes studied contained approximately seven condensed aromatic rings attached to short aliphatic chains of 4 to 6 carbons. The 1H and 13C NMR spectra of a sample asphaltene from this series are presented in Figure 27 and Figure 28, the latter showing 13C NMR spectra for aliphatic (a) and aromatic (b) carbons separately.
![[{"id":"hcOQVED-wK","type":"paragraph","data":{"text":"The <sup>1</sup>H NMR spectrum of a neat asphaltene derived from Algerian Hassi Messaoud oil field recorded at 300.13 MHz in CDCl<sub>3</sub>. Reproduced from Fergoug and Bouhadda[[ type=\"anchor\" referenceId=\"5876\" ]] with the permission of Elsevier."}}]](/storage/images/resized/ZT5ViEjNwycC0tI1SG29Ak8jVhSw167iEzBwA34B_xl.webp)
![[{"id":"MWDkAtOfvk","type":"paragraph","data":{"text":"The <sup>13</sup>C NMR spectrum of a neat asphaltene derived from Algerian Hassi Messaoud oil field recorded at 75.47 MHz in CDCl<sub>3</sub> showing (a) aliphatic and (b) aromatic regions. Reproduced with minor editing privilege from Fergoug and Bouhadda[[ type=\"anchor\" referenceId=\"5876\" ]] with the permission of Elsevier."}}]](/storage/images/resized/I8cOHkS5HCoYRKmzosry5Eonu0WEtOQEEev39v35_xl.webp)
Typical ranges of 1H and 13C NMR chemical shifts of various asphaltenes are given accordingly in Table 5 and Table 6 compiled from Ok and Mal[40].
![Typical ranges of <sup>1</sup>H NMR chemical shifts of functional groups defining the composition of asphaltenes. Compiled from Ok and Mal[<a class="anchor" href="#reference-5874">37</a>].](/storage/images/resized/DVmhoAgRGsapqUrQtGKABJR0k9DGbddB557ZKaLG_xl.webp)
![Typical ranges of <sup>13</sup>C NMR chemical shifts of functional groups defining the composition of asphaltenes. Compiled from Ok and Mal[<a class="anchor" href="#reference-5874">37</a>].](/storage/images/resized/thSfHeFWYy4NxMK5aoMpTH8EIL5rBsGJ51ERB9gj_xl.webp)
2.4. Crude oil
NMR has unique advantages in the geochemical analysis of crude oil because it can provide robust information on chemical functional groups including those in aliphatic hydrocarbons, cycloalkanes, aromatic hydrocarbons, and other important components of crude oil.
In a recent publication, Gao and coauthors[40] investigated crude oil from the Eocene Shahejie Formation in Lake Dongpu Sag, China by means of 1H and 13C NMR. Figure 29 and Figure 30 taken from this publication provide 1H and 13C NMR typical spectra of crude oils from that source, accordingly. The crude oils studied are kerogens (a complex mixture of organic chemical compounds that make up the most abundant fraction of organic matter in sedimentary rocks).
![[{"id":"fSmfSxwtJr","type":"paragraph","data":{"text":"Typical <sup>1</sup>H NMR spectrum of the analyzed kerogens in CDCl<sub>3</sub>. Reproduced with minor editing privilege from Gao et al.[[ type=\"anchor\" referenceId=\"5877\" ]] with the permission of Elsevier."}}]](/storage/images/resized/qNuIFKm6u9UAO6WgTYTwDxek2qPnapwvxF0AGHPT_xl.webp)
![[{"id":"6q5cKkBoDi","type":"paragraph","data":{"text":"Typical <sup>13</sup>C NMR spectrum of the analyzed kerogens in CDCl<sub>3</sub>. Reproduced with minor editing privilege from Gao <i>et al.</i>[[ type=\"anchor\" referenceId=\"5877\" ]] with the permission of Elsevier."}}]](/storage/images/resized/TDys7vixL9Nl9TQ1unB4vhs6Tpl2y1kZfvoDgL9c_xl.webp)
It was found that the types of hydrogen atoms in the crude oils studied were mainly β and γ hydrogens (Hβ and Hγ, respectively), and the contents of α hydrogens (Hα) and alkene hydrogens (HC=C) were very low, as illustrated in Figure 29. In this case, the predominant carbon atom type was saturated carbon, with a smaller contribution from aromatic and heteroatomic carbons (see Figure 30). The hydrogen types Hγ and Hβ were found to be more sensitive to the organic matter source than carbons. High Hγ values indicated that studied crude oil was rich in polysubstituted alkanes, and its organic matter source was algae. On the other hand, high Hβ values indicated that studied crude oil had a high wax content, and its organic matter source was the higher plants.
A general conclusion formulated by the authors[40] was that with increasing input of aquatic organisms, Hγ and methyl carbon in the chemical structure of the crude oil increased, while Hβ decreased. Here, 1H NMR spectra were more useful than 13C NMR spectra in elucidating the sources of organic matter. Specifically, the principal finding of the study was that ‘NMR parameters reflect the source rock depositional environment, and organic matter source and thermal maturity. 1H NMR spectroscopy is a fast analytical method, but it provides little information about chemical structure. In contrast, 13C NMR spectroscopy can provide more information regarding chemical structure. 1H NMR spectroscopy is more useful for evaluation of the organic matter source, whereas 13C NMR spectroscopy is more useful for the evaluation of organic matter thermal maturity... NMR analysis can constrain the chemistry of crude oil, particularly the composition of functional groups’[40].
Recently a series of papers have been published by Rakhmatullin and coauthors dealing with qualitative and quantitative analysis of oil samples based on NMR data, see two very recent reviews[41, 42]. In one of the first publications[43] from this series, the authors recorded representative 1H and 13C NMR spectra of the crude oil samples from Bashkortostan and Tatarstan oilfields using a 700 MHz spectrometer. The representative 1H and 13C NMR spectra taken from that publication are provided in Figure 31 – Figure 33. On the basis of these data, the quantitative fractions of aliphatic and aromatic molecules (tertiary and primary carbon atoms, aromatic rings, olefins), together with the functional groups constituting oil hydrocarbons were determined and their variation from sample to sample of particular geographical origin was analyzed.
![[{"id":"lQPPzDG8fQ","type":"paragraph","data":{"text":"<sup>1</sup>H NMR spectrum (700 MHz) of oil sample from the top of Bashkirian oil well (Akansk field) in CCl<sub>4</sub> (inserts show zoomed signals of aromatic and aliphatic protons). Residual water signal in the capillary is marked with asterisk. Reproduced from Rakhmatullin et al.[[ type=\"anchor\" referenceId=\"5880\" ]] with the permission of Elsevier. "}}]](/storage/images/resized/HmWyaVTz0PeTqZQxNMX0eM2dGngvPvd0AhO3Bzi9_xl.webp)
![[{"id":"L3-04GwJlU","type":"paragraph","data":{"text":"The HSQC <sup>13</sup>C NMR spectrum (176 MHz) of oil sample from the top of Bashkirian oil well (Akansk field) in CCl<sub>4</sub>. Reproduced from Rakhmatullin et al.[[ type=\"anchor\" referenceId=\"5880\" ]] with the permission of Elsevier."}}]](/storage/images/resized/cwE1IvNZu0MjF0pvv13OiBsVa3bfOVjpJ68jHckl_xl.webp)
![[{"id":"hR4Qa60Od6","type":"paragraph","data":{"text":"The two-dimensional <sup>1</sup>H–<sup>13</sup>C HSQC NMR spectrum (700 MHz) of oil sample from the top of Bashkirian oil well (Akansk field) in CCl<sub>4</sub>. Reproduced from Rakhmatullin <i>et al.</i>[[ type=\"anchor\" referenceId=\"5880\" ]] with the permission of Elsevier."}}]](/storage/images/resized/T4uIScZACgaypTKCa8j2fzr5PQVHZstXDezfPgrK_xl.webp)
Figure 31 provides some interesting details in the 1H NMR spectrum of the selected oil sample recorded at 700 МHz which are not present in the lower-field NMR spectra. For example, the multiple individual methyl signals can be distinguished in the region of 0.8 – 1.0 ppm. It means that the studied oil sample contains hydrocarbon chains of several different types, each having its own set of terminal methyl groups.
The HSQC 13C NMR spectrum of the same oil sample is shown in Figure 32. This experiment made it possible to distinguish primary and tertiary carbons from the secondary and quaternary carbons. Generally, if a 13C atom is bound to an odd number of protons, a positive signal is observed; in the case of an even number of protons, the negative peaks appear. It allows the assignment of corresponding signals in the overlapping areas of CH and CH2 resonances.
Some additional information was provided by the two-dimensional 1H – 13C HSQC NMR spectra exemplified for the same sample in Figure 33. However, low digital resolution in both dimensions and rapid decay of the NMR signals are the main drawbacks of using 2D NMR technique in petroleum chemistry. As an example of these disadvantages, individual signals in the highfield region (0.5 – 2 ppm in the 1H and 20 – 50 ppm in the 13C NMR spectra) are difficult to distinguish.
In the next publication Rakhmatullin and coauthors[44] used 1H and 13C NMR to study three samples of light paraffinic crude oil and one sample of heavy aromatic crude oil, namely two samples of the Middle – Nazym oilfield (Russia, viscosity 5.95 and 7.5 mPa · s), a sample from the Vishanskoe oilfield (Belarus, viscosity 37.2 mPa · s), and a heavy sample from the Ashal’cha 22 oilfield (Tatarstan, viscosity 2.420 mPa · s). The representative 1H and 13C NMR spectra recorded at 500 and 700 MHz for protons (126 and 176 MHz for carbons, accordingly) are shown in Figure 34 – Figure 37. In the last two figures from this series, the samples of crude oil were taken from the Middle – Nazym oilfield, Russia (1, 2); the Vishanskoe oilfield, Belarus (3); and the Ashal’cha oilfield, Tatarstan (4). In that paper, the quantitative fractions of aromatic molecules and functional groups constituting oil hydrocarbons were determined, and a comparative analysis of the oil samples of different viscosity and origin was performed.
![[{"id":"_UPhfg0D8y","type":"paragraph","data":{"text":"<sup>1</sup>H NMR spectra of the Middle–Nazym oilfield sample (Russia, viscosity 7.5 mPa · s) at 500 and 700 MHz in CCl<sub>4</sub>. Reproduced from Rakhmatullin <i>et al.</i>[[ type=\"anchor\" referenceId=\"5881\" ]] under the CC BY-NC 4.0 International Public License."}}]](/storage/images/resized/5Ps69nrebARYq2GHkF1ZPQkCg9NbmoDWsoFLBqNs_xl.webp)
![[{"id":"lWdSR95z2n","type":"paragraph","data":{"text":"<sup>13</sup>C NMR spectra (aliphatic region) of the Middle–Nazym oilfield sample (Russia, viscosity 7.5 mPa · s) at 126 and 176 MHz in CCl<sub>4</sub>. Reproduced from Rakhmatullin <i>et al.</i>[[ type=\"anchor\" referenceId=\"5881\" ]] under the CC BY-NC 4.0 International Public License."}}]](/storage/images/resized/84Q9IbnrYjKI7PWePdsnsZoNoz0qREC30UKjxZHz_xl.webp)
![[{"id":"1XOUIXyLbo","type":"paragraph","data":{"text":"The aromatic region of the <sub>13</sub>C NMR spectra (176 MHz, CCl<sub>4</sub>) of the Middle–Nazym oilfield sample (Russia, viscosity 7.5 mPa · s) (1); the Middle–Nazym oilfield sample (Russia, viscosity 5.95 mPa · s) (2); the Vishanskoe oilfield sample (Belarus, viscosity 37.2 mPa · s) (3); the Ashal’cha oilfield sample (Tatarstan, viscosity 2420 mPa · s), (4). Reproduced from Rakhmatullin <i>et al.</i>[[ type=\"anchor\" referenceId=\"5881\" ]] under the CC BY-NC 4.0 International Public License."}}]](/storage/images/resized/Gb5DEcKkswQiZllMS7YcnPhQbLorVOs46nKoaRqB_xl.webp)
![[{"id":"WISGegXfev","type":"paragraph","data":{"text":"The aliphatic region of the <sup>13</sup>C NMR spectra (176 MHz, CCl<sub>4</sub>) of the Middle–Nazym oilfield sample (Russia, viscosity 7.5 mPa · s) (1); the Middle–Nazym oilfield sample (Russia, viscosity 5.95 mPa · s) (2); the Vishanskoe oilfield sample (Belarus, viscosity 37.2 mPa · s) (3); the Ashal’cha oilfield sample (Tatarstan, viscosity 2420 mPa · s), (4). C<sub>p</sub>, C<sub>s</sub> , and C<sub>t</sub> stand accordingly, for primary, secondary, and tertiary carbons. Reproduced from Rakhmatullin <i>et al.</i>[[ type=\"anchor\" referenceId=\"5881\" ]] under the CC BY-NC 4.0 International Public License."}}]](/storage/images/resized/FCXUPcQvX16Y6a7EORp2BQKK4WyrAOIJbCKFsZXw_xl.webp)
In the next paper in the series, Rakhmatullin and coauthors[45] examined in the same way three low-viscosity light, one semi-heavy, and two high-viscosity crude oils samples provided by Tatneft, Zarubezhneft and RITEK oil companies (Russia). Quantitative fractions of aromatic molecules and functional groups constituting oil hydrocarbons were determined by means of 1H and 13C NMR spectroscopy, and comparative analysis of the oil samples with different viscosity, origin and preliminary treatment was carried out. Representative 1H and 13C NMR spectra (recorded at at 500 and 125 MHz, accordingly) are shown in Figure 38 and Figure 39.
![[{"id":"cewj8m3jhD","type":"paragraph","data":{"text":"<sup>1</sup>H NMR spectra (500 MHz, CCl<sub>4</sub>) of the following crude oil samples: 1 — high pressure air injection (viscosity 7.5 mPa · s), 2 — primary recovery (viscosity 5.95 mPa · s), 3 — high pressure air injection (viscosity 37.2 mPa · s), 4 — primary recovery (viscosity 106 mPa · s), 5 — steam-assisted gravity drainage (viscosity 2420 mPa · s), 6 — cyclic steam stimulation (viscosity 49700 mPa · s). Reproduced from Rakhmatullin <i>et al.</i>[[ type=\"anchor\" referenceId=\"5882\" ]] with the permission of Elsevier."}}]](/storage/images/resized/IHCruayO4PYCsvkuo8PVSN7SPMYfxv8VEB1uOp7Q_xl.webp)
![[{"id":"pSsrsmsLJL","type":"paragraph","data":{"text":"<sup>13</sup>C NMR spectra (125 MHz, CCl<sub>4</sub>) of the following crude oil samples: 1 — high pressure air injection (viscosity 7.5 mPa · s), 2 — primary recovery (viscosity 5.95 mPa · s), 3 — high pressure air injection (viscosity 37.2 mPa · s), 4 — primary recovery (viscosity 106 mPa · s), 5 — steam-assisted gravity drainage (viscosity 2420 mPa · s), 6 — cyclic steam stimulation (viscosity 49700 mPa · s). Reproduced from Rakhmatullin <i>et al.</i>[[ type=\"anchor\" referenceId=\"5882\" ]] with the permission of Elsevier."}}]](/storage/images/resized/YMbQsAQseWDWyKfYYYdvAvsLQ794EXnsYER9D6eE_xl.webp)
As a follow-up to these studies, the same principal authors[46] examined four different heavy oil samples of different geographical origin with the viscosities ranging from 100 to 50 000 mPa · s, as specified in Table 7. The presence of all major hydrocarbon components, both in crude oil and in each of its fractions, was established quantitatively by using 13C NMR spectroscopy. The 13C NMR spectra of crude oils 1 – 4 and their fractions (saturated compounds, aromatics, resins, and asphaltenes) studied in that paper are shown in Figure 40 and Figure 41, accordingly, while calculated molar fractions of primary, secondary and quaternary, tertiary, and aromatic carbons, together with aromaticity factor and mean chain length of aliphatic hydrocarbons are shown in Table 8.
![[{"id":"M-3uH1pGFb","type":"paragraph","data":{"text":"<sup>13</sup>C NMR spectra (175 MHz) of oil samples 1–4 in CDCl<sub>3</sub>. Reproduced from Rakhmatullin <i>et al.</i>[[ type=\"anchor\" referenceId=\"5883\" ]] under the CC BY-NC 4.0 International Public License."}}]](/storage/images/resized/M1GfON4OtvRYqUk1Rk4SDoM7zHBtfSCTUBYmzGGl_xl.webp)
It can be seen that the oil sample from Cuba, in contrast to the other three samples from Iraq, Turkmenistan, and Tatarstan, had the lowest content of secondary and quaternary carbons (36.6%) and the highest content of aromatic carbons (27.5%) resulting in the highest value of aromaticity factor (0.275).
![Molar fractions (%) of primary (C<sub>p</sub>), secondary and quaternary (C<sub>sq</sub>), tertiary (C<sub>t</sub>), and aromatic (C<sub>ar</sub>) carbons, together with aromaticity factor (FCA), and average chain length (ACL) of aliphatic hydrocarbons based on the analysis of <sup>13</sup>C NMR spectra of samples 1 – 4. Compiled from Rakhmatullin et al[<a class="anchor" href="#reference-5883">46</a>].](/storage/images/resized/Akq0hAEzMsSj2noedT2Xt0AXbnKzinkkpCDm16h2_xl.webp)
![[{"id":"1id2R-HMNN","type":"paragraph","data":{"text":"<sup>13</sup>C NMR spectra (175 MHz) of the main oil fractions (saturated compounds, aromatics, resins, and asphaltenes) in CDCl<sub>3</sub>. Reproduced with minor editing privilege from Rakhmatullin <i>et al.</i>[[ type=\"anchor\" referenceId=\"5883\" ]] under the CC BY-NC 4.0 International Public License."}}]](/storage/images/resized/z52ljsfvWS0VpUrAw53l2zlz5ND9mB0jqOc7vq7u_xl.webp)
Based on the results of that study,46 authors concluded that generally, 13C NMR spectroscopy could significantly expand the ‘repertoire’ (the word in quotation marks is taken from the original text) of the research methods to study structural-group composition of oil and oil fractions. It also adequately described, qualitatively and quantitatively, not only the elemental composition of oil samples 1 – 4, but also the molecular structures of the related natural organic material, its fractions, and intermediate and target products. It was also demonstrated that the high-field 13C NMR spectroscopy made it easy to establish the quantitative presence of the main hydrocarbon components in the main oil fractions including saturated compounds, aromatics, resins, and asphaltenes.
In a more detailed 1H and 13C NMR study of the crude oil from the Cuban oilfield and the oil-containing rock samples from the Cuban basin listed in Table 9, Rakhmatullin et al.[47] studied the composition of various structural fragments of these samples in the aliphatic and aromatic regions and evaluated the molar fractions of primary, secondary, quaternary, tertiary, and aromatic groups together with the aromaticity factor and the average length of the hydrocarbon chain of aliphatic hydrocarbons. The 1H and 13C NMR spectra of the crude oil and oil-containing rock samples investigated (five oil-containing rock samples were studied in this paper, designated III-5, VIII-1, VIII-3, VIII-4, VIII-5, and IX-2) are shown in Figure 42 and Figure 43, respectively. These data demonstrated that their aromaticity factor and average hydrocarbon chain length were close to those of the super heavy oils.
![Molar fractions (%) of primary (C<sub>p</sub>), secondary and quaternary (C<sub>sq</sub>), tertiary (C<sub>t</sub>), and aromatic (C<sub>ar</sub>) carbons, together with the aromaticity factor (FCA), and the average chain length (ACL) of aliphatic hydrocarbons of the Cuban oil and oil-containing rock extractions derived from <sup>13</sup>C NMR spectra. Compiled from Rakhmatullin et al[<a class="anchor" href="#reference-5884">47</a>].](/storage/images/resized/4uGtylgDFafvmekRoyKKfKbvIIWkUkmp2n6nh0II_xl.webp)
![[{"id":"e-Sy6qUxma","type":"paragraph","data":{"text":"<sup>1</sup>H NMR Spectra (700 MHz) of the Cuban oil and extracted samples from the oil-containing rocks (specified as III-5, VIII-1, VIII-3, VIII-4, VIII-5, IX-2) in CDCl<sub>3</sub>. Reproduced from Rakhmatullin <i>et al.</i>[[ type=\"anchor\" referenceId=\"5884\" ]] under the CC BY-NC 4.0 International Public License."}}]](/storage/images/resized/sd1RwprGj245LbdmIqP1of87QKv8HOUOQ3PbRmCe_xl.webp)
![[{"id":"VamxfaG9Pv","type":"paragraph","data":{"text":"<sup>13</sup>C NMR spectra (175 MHz) of the Cuban oil and extracted samples from the oil-containing rocks (specified as III-5, VIII1, VIII-3, VIII-4, VIII-5, IX-2) in CDCl<sub>3</sub>. Reproduced from Rakhmatullin <i>et al.</i>[[ type=\"anchor\" referenceId=\"5884\" ]] under the CC BY-NC 4.0 International Public License."}}]](/storage/images/resized/TyZW4CqcNKOAekj23rTOtNU0KJtIHGwyFttnHXYD_xl.webp)
In one of their most recent papers, Rakhmatullin et al.[48] proposed a comprehensive method for identifying signals in the 13C NMR spectra of crude oils exemplified with a typical crude oil sample providing 66 individual resonances in the 13C NMR spectrum recorded on a 700 MHz spectrometer (175 MHz for 13C NMR). In that study, authors used normal proton-decoupled (13C), 13C Attached Proton Test (13C APT), and 13C with Gated Decoupling (13C GD) modes. All characteristic signals are shown in Figure 44 – Figure 46, while the corresponding 13C NMR chemical shifts are listed in Table 10.
![The detailed characterization of the <sup>13</sup>C NMR spectrum of a typical oil sample (signals 1 – 22: aromatic area; signals 23 – 46: lowfield aliphatic area; signals 47–66: highfield aliphatic area). Compiled from Rakhmatullin et al[<a class="anchor" href="#reference-5885">48</a>].](/storage/images/resized/HYx0JvhNBGcrkZ0taeJleQ06MARywCr2bn1gCTWW_xl.webp)
![[{"id":"BDzfP3abvu","type":"paragraph","data":{"text":"Labeling peaks in the <sup>13</sup>C NMR spectra (175 MHz, CDCl<sub>3</sub>) of a crude oil sample (aromatic area). Reproduced from Rakhmatullin <i>et al.</i>[[ type=\"anchor\" referenceId=\"5885\" ]] under the CC BY-NC 4.0 International Public License."}}]](/storage/images/resized/msRp9NFah84Imz1UWI45HaQFaq5z8ZR8uEdfZe9L_xl.webp)
![[{"id":"RcFKeNv036","type":"paragraph","data":{"text":"Labeling peaks in the <sup>13</sup>C NMR spectra (175 MHz, CDCl<sub>3</sub>) of a crude oil sample (lowfield aliphatic area). Reproduced from Rakhmatullin <i>et al.</i>[[ type=\"anchor\" referenceId=\"5885\" ]] under the CC BY-NC 4.0 International Public License."}}]](/storage/images/resized/QFxVtQSsEK5t0T4zoPUNU0gtp61ypM8KHtn20SWs_xl.webp)
![[{"id":"rP71i3NHWX","type":"paragraph","data":{"text":"Labeling peaks in the <sup>13</sup>C NMR spectra (175 MHz, CDCl<sub>3</sub>) of a crude oil sample (highfield aliphatic area). Reproduced from Rakhmatullin <i>et al.</i>[[ type=\"anchor\" referenceId=\"5885\" ]] under the CC BY-NC 4.0 International Public License."}}]](/storage/images/resized/7yQu4OeDVj7fr7jqdz5HmWMe5kCjDiHN8kb2FNE6_xl.webp)
As was stated by one of the reviewers, ‘one can find some gaps or silences (see the absence of comments on the signal in Figure 45 which appears unnumbered between 36 and 37), discrepancies between the chemical shifts of Table 10 with the figure (signal 36 at 51.31 ppm and signal 37 at 51.14 ppm — in the figure signal 37 appears to be at deltas less than 51)’. We leave this comment for a more thorough consideration by the readers of this review.
A general conclusion of the latter study was that ‘the use of 13C NMR spectroscopy to study structural-group composition of oils and oil fractions can expand the accurate methods of quantitative analysis, adequately describing not only the elemental composition, which is now of no difficulty, but also the molecular structure and supramolecular structure of natural organic material, its fractions, intermediate products and target products. NMR spectroscopy methods make it easy to establish the quantitative presence of the main hydrocarbon components in any fraction of oil. Information on the content of general functional groups obtained by 13C NMR spectroscopy can be useful for fast prediction of oil product properties changing upon different type of treatment’[48].
3. Conclusion
The latest achievements in the NMR studies of oil and oil refining products reviewed are at the cutting edge of modern oil refining chemistry and petrochemical industry.
Light fractions. In general, there is an overwhelming number of publications dealing with NMR applications to the structural elucidation of gasoline, light naphthas and their fractions. 1H and 13C NMR are also used in fuel industry to estimate reservoir properties such as porosity, permeability, wettability, irreducible water saturation, and irreducible oil saturation. In fact, the exploration and production of oil-refining products essentially benefited from the NMR application to the evaluation of oil-refining products.
Much structural information is provided by the 1H and 13C NMR spectra of naphthas, i.e. the mixtures consisting mainly of aliphatic hydrocarbons, predominantly the open-chain and cyclic pentane and hexane derivatives. The application of NMR spectroscopy to the structural elucidation of naphthas has enabled a number of structural applications, in particular the following:
— determination of gasoline octane number based on the correlation between octane number and chemical composition of fluid catalytic cracking gasoline;
— determination of the composition of aromatics, naphthenes, and paraffins in straight run gasoline fractions;
— performing quantitative analysis of naphthene and isoparaffin mixtures consisting of different types of cycloalkane molecules with boiling points in the gasoline range together with a rapid and accurate quantitative determination of the composition and quality of different gasolines;
— development of a direct and fast method based on the 1H NMR spectroscopy for the determination of paraffins, olefins, naphthenes, and aromatics;
— development of an improved model for predicting the quality of hydrocarbon fuels by means of 1H NMR using a calibration set of cetane numbers of pure hydrocarbons and hydrocarbon blends of known composition;
— development of a novel approach to the analysis of light naphthas by means of the NMR spectra of five key structural groups, namely paraffinic CH3, CH2, and CH, naphthenic CH‒ CH2, and aromatic C – CH;
— development of a powerful method for the accurate determination of quaternary, methine, methylene, and methyl carbons together with the identification of conjugated diolefins in gasolines by two-dimensional NMR techniques.
Fuels. Straight run diesels, a representative example of fuels, are characterized by a narrow distribution of aromatics, while naphthenic diesels display a wide unresolved ‘hump’ in the aliphatic carbon region, which can be attributed to the fraction of naphthenic and paraffinic carbons. The DEPT technique allows methyl, methylene, methane, and quaternary carbons of fuels to be observed separately in the 13C NMR spectra, providing an average aromatic ring size and other important average molecular parameters, so that the whole refinery processing can be monitored. The use of the HSQC method allows for the determination of the fuel-specific integral regions in the 13C NMR spectra of diesel fuels together with the identification of overlapping peaks. Here, important information can be obtained from the 13C NMR spectra of diesel fuels, such as average chain length, alkyl substitution, aromatic carbon distribution, iso-paraffinic content, and branching index together with the branching structures of iso-paraffins and related hydrocarbons. NMR spectroscopy combined with artificial neural networks makes it possible to predict two of the most commonly employed octane ratings of diesel fuels, namely the research octane numbers and the motor octane numbers.
Asphaltenes. Asphaltenes, a complex natural mixture of organic compounds together with chemically incorporated metal complexes, consist of aromatic cores bonded to aliphatic and aromatic molecules containing heavy metals. NMR spectroscopy is widely used to characterize the chemical structure of asphaltenes and to describe their chemical behavior. Only protonated carbons are usually observed in the DEPT spectra of asphaltenes. The average structure of asphaltenes contains seven condensed aromatic rings attached to each other by short aliphatic chains of 4 to 6 carbons, as shown by both 1H and 13C NMR spectra. It was established that the coal-derived asphaltenes were essentially smaller than those of the original petroleum asphaltenes. Herein, the interior bridgehead carbons are an important component of asphaltenes correctly accounting for the number of fused rings in the sample. Significantly longer chains of at least 9 carbons are characteristic of petroleum asphaltenes, as compared to the coal-derived asphaltenes.
Crude oil. NMR spectroscopy is widely used for the structural elucidation of natural organic materials like crude oil and oil-refining products, essentially extending the limits of other physical methods. It is useful for rapid and robust prediction of oil properties adequately describing not only the composition, but also the molecular and supramolecular structure of crude oil, its fractions, and oil-processing products. Generally, 13C NMR spectroscopy could significantly expand the applicability of the research methods to study the structural-group composition of oil and oil fractions. High-field 13C NMR spectroscopy makes it easy to quantitatively determine the presence of the main hydrocarbon components in the main oil fractions including saturated compounds, aromatics, resins, and asphaltenes. NMR has unique advantages in the geochemical analysis of crude oil because it can provide extensive information on the general chemical structure including the specification of functional groups in aliphatic hydrocarbons, cycloalkanes, aromatic hydrocarbons as well as the composition of functional groups and other important components of crude oil. 13C NMR normal proton-decoupled, attached proton test, and gated decoupling modes together with two-dimensional pulse methods like COSY, NOESY (Nuclear Overhauser effect SpectroscopY), and ROSY (Relaxation Ordered SpectroscopY) together with many others are widely used to determine tertiary and primary carbon atoms, aromatic rings, and olefins. As an illustrative example, the HSQC experiment allows primary and tertiary carbons to be distinguished from secondary and quaternary ones.
4. Abbreviations
ACL — Average Chain Length,
APT — Attached Proton Test,
COSY — COrrelated SpectroscopY,
DEPT — Distortionless Enhancement by Polarization Transfer,
FACE — Fuels for Advanced Combustion Engines,
FCA — Aromaticity Factor,
GD — Gated Decoupling,
HSQC — Heteronuclear Single Quantum Coherence,
MON — Motor Octane Number,
NMR — Nuclear Magnetic Resonance,
PONA — Paraffins, Olefins, Naphthenes, and Aromatics,
RON — Research Octane Number.
References