Keywords
Abstract
Pulsed dipolar spectroscopy (PDS) in electron paramagnetic resonance (EPR) allows studying magnetic dipole-dipole interactions between the spins of unpaired electrons located in the nanometer range of distances from each other. The methods of PDS include double electron-electron resonance (DEER), double quantum coherence (DQC), single frequency technique for refocusing dipolar couplings (SIFTER), relaxation-induced dipolar modulation enhancement (RIDME), and the simple twopulse electron spin echo method (2p ESE). Previously published reviews on the application of PDS methods have focused primarily on the study of doubly spin-labeled nanoscale molecules; the aim of this review is to discuss the potential of PDS for nanoscale oligomers and clusters of molecules containing more than two spin labels. The review attempts to comprehensively analyze the limitations of PDS methods that arise for these systems and possible ways to overcome them, and analyzes the experimental data already obtained.
The bibliography includes 136 references.
1. Introduction
For studying the structure of biological and other heterogeneous systems at the nanometer scale, X-ray diffraction, cryo-electron microscopy, and NMR are most often used. Of course, any physicochemical method has its limitations. In the first case, crystallization of the substance, a high degree of purification, selection of a suitable solvent, and monodispersity of the sample are required. Working with small crystals also presents challenges. In the second case, difficulties with sample preparation also arise and, in addition, there is a risk of damage to the sample by irradiation. In the third case, only small-sized systems (usually weighing no more than 10 kDa) can be studied.
In this regard, the use of the EPR spin label method in structural studies offers some advantages, since it allows one to study substances that are closer to the native state. Another important factor is the ability to select a specific region of a molecule for study. Among the various EPR methods, pulsed dipolar EPR spectroscopy (PDS-EPR, or simply PDS) is of particular importance. Due to its sensitivity to the nanometer range of distances, this method makes it possible to study the nanostructures of spin-labeled macromolecular systems. (It should be noted that the Förster resonance energy transfer (FRET) method can also be used for similar purposes.)
Nanostructures are present in protein systems as secondary and tertiary structures, including nanoscale oligomers of protein subunits. Nanosized oligomers exist in various objects of supramolecular chemistry. The cell membranes of living organisms are themselves nanoscale objects due to the thickness of the lipid bilayer that forms them (5 – 7 nm). Moreover, guest molecules in these membranes — such as antimicrobial peptides and other drug molecules — can form lateral lipid-mediated nanoclusters. Nanostructures can also arise in polymers if their structure is heterogeneous; for guest molecules, this heterogeneity can lead to the appearance of nanoclusters of these molecules.
In the PDS, the magnitude of magnetic dipole-dipole (d-d) interactions between the spins of unpaired electrons is measured. All PDS approaches are based on the phenomenon of electron spin echo (ESE). The ESE signal is generated after two or more microwave pulses are applied to the spin system of unpaired electrons of spin labels in a magnetic field. PDS methods can be divided into double-frequency and single-frequency. The first type is the double electron-electron resonance method (DEER, also known as PELDOR — short for pulsed DEER).[1-7] The second type includes the methods of double quantum coherence (DQC),[8-10] single frequency technique for refocusing dipolar couplings (SIFTER),[11][12] relaxation-induced dipolar modulation enhancement (RIDME).[13-16]
Single-frequency methods also include the less common simple two-pulse ESE method (2p ESE). This method has proven effective in studying spin-polarized radical pairs,[17-22] and can also be used to study biradicals in thermal equilibrium.[23] Sometimes, other single-frequency methods are also used, e.g., the so-called ‘2+1’ method, the DEER method with a magnetic field jump, and the method of selective hole burning in the EPR spectrum.[10][24][25]
PDS methods are typically used for doubly-spin-labeled nanoscale molecules, in which the distances between the labels are measured to determine the conformations of the molecules. This review is devoted to the study of the supramolecular structure of nanoscale oligomers and molecular clusters containing more than two spin labels. These issues have already been addressed to varying degrees in several reviews.[3-6][10][24][26][27] However, at present there is a need for a more detailed examination of the possibility of applying PDS methods to the study of the structure of such systems, which is due to the rather complex methodological problems that arise here. The analysis of these issues in the existing literature is not entirely sufficient, and in some fundamental aspects it is simply absent. And this circumstance may become a limiting factor for further research in this area.
2. Methods of pulsed dipolar EPR spectroscopy
PDS methods are typically used at low temperatures (below 80 K) to remove other types of interactions of unpaired electron spins that depend on molecular motion. In some favourable situations, studies at room temperature are also possible,[28] but again, in conditions of motionlessness. That is, we are dealing with the study of a solid state.
PDS methods are well developed for biradicals (i.e., for two-spin systems); for the sake of completeness and clarity, we will first describe the results known for these systems. We begin with a brief description of the theory of d-d interactions.
2.1. D-d interaction
The magnitude of the d-d interaction between two electron spins separated by a distance r is determined by the expression:[1-7]
where g is the g-factor (for nitroxide spin labels it can be considered the same for both spins), μB is the Bohr magneton, θ is the angle between the vector r connecting the two spins and the direction of the external magnetic field B, μ0 is the magnetic permeability of vacuum. For the D value, in the case of nitroxide spin labels, it is convenient to use the relation (here D is in MHz, r is in nm):[5]
In continuous-wave (CW) EPR, the d-d interaction leads to line broadening. This broadening can be noticeable if it is comparable to the intrinsic line width. The value of the latter for nitroxides in the solid phase can estimated to be around 15 – 30 MHz. From formula (2), we then immediately obtain an upper limit in CW EPR for the measurable distances rmax of about 1.2 – 1.5 nm. It should be noted that, in addition to nitroxides, other types of spin labels can be used, for which the EPR spectral widths may be either significantly smaller[23][29] or significantly larger[27] than the values specified for nitroxides. Accordingly, rmax in CW EPR may be either larger or smaller.
The measured signal in all PDS methods is determined by cos(Dt), where t is the delay time between microwave pulses (different for different methods). The minimum value of t is the pulse duration tp ,[5][30] which can vary slightly for different spectrometer versions and different microwave ranges; typically, tp is between 10 and 30 ns. From the condition of acquiring a phase equal to unity, Dtр ≈ 1, we obtain the minimum distance rmin achievable in PDS in the range from 1.5 to 2 nm, respectively. The maximum time tmax is a value of the order of the transverse relaxation time of spins T2; in frozen organic and biological media, this value is of the order of a microsecond (it can vary depending on the nearest nuclear environment of the spin label — T2 is shortened due to mutual flip-flop reversals of the spins of the nuclei[31][32]). At T2 ≈ 10–6 s, from the condition DТ2 ≈ 1 we obtain the maximum value of the measured distances rmax of the order of 7 nm. If additional efforts are made to increase this time (for example, by deuterating the spin label and solvent[32]), the upper limit of rmax may become noticeably larger.
Due to the signal dependence on time t in the form cos(Dt), PDS data processing methods based on the Fourier transform can be particularly effective. For narrow distance distributions in a pair of spins, this leads to sharp peaks in the frequency spectra and, as a consequence, to particularly high measurement accuracy, which can be no worse than ± 0.5% of the measured distance.[19][23]
The total spin Hamiltonian of two spins A and B in a pair is given by the expression:

where wA and wB are the resonant frequencies of these spins in the absence of d-d interaction. The first term in parentheses is called the secular part of the d-d interaction, the second term is called the pseudosecular part. The exchange interaction in a pair of spins is neglected here and below: for distances in the nanometer range it usually turns out to be insignificant (the exchange can manifest itself in nanometer-sized biradicals with a system of conjugated bonds[33]).
The solution to Hamiltonian (3) can be sought in different ways depending on the relationship between the frequency difference Δω = ωА – ωВ and the value of ωdd . In the case when Dw2 >> w2dd (the so-called case of weak coupling of two spins), the pseudosecular term in Hamiltonian (3) in the first order of perturbation theory makes a small contribution and can be ignored. Then the splitting in the spectrum due to the d-d interaction is given by formula (1). In the opposite case, when Dw2 ≤w2dd (the case of strong coupling), the pseudosecular term cannot be discarded and the solution becomes more complicated.
2.2. Double electron-electron resonance (DEER)
The most commonly used PDS method is DEER. This method uses pulses at two EPR resonant frequencies, assuming the EPR spectrum is broad enough so that the spectral densities of pulses at different frequencies do not overlap. At the resonant frequency of spins A, an echo signal is observed. At the second resonant frequency, the other spins B are exposed to a pulse called the pump pulse, which changes their orientation relative to the magnetic field. In the DEER experiment, the condition of weak coupling between the two spins is usually satisfied, Dw2 >> w2dd.
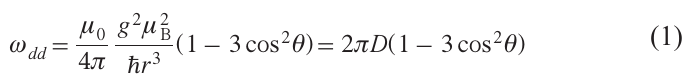
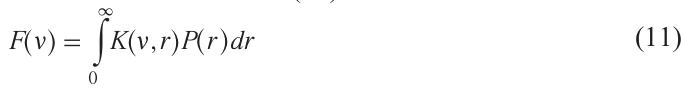
Initially, the DEER method was proposed[1][2] in a three-pulse version — two echo-forming pulses at one frequency (usually 90° and 180°) and a pump pulse (usually 180°) at another frequency (Fig. 1a). The pump pulse is scanned over time t in the range from some negative value to t = τ. In these first experiments, the observation and pump pulses were generated by two different generators fed from different electrical networks, and a bimodal resonator[3] was used in which the observation and pump pulses were applied to the sample in two combined but different resonators in which the microwave fields were perpendicular to each other.
![[{"id":"mWExKxtm4M","type":"paragraph","data":{"text":"Timing diagram of pulse sequences for (<i>a</i>) three- and (<i>b</i>) four-pulse experiments in DEER. In the first case, the primary echo signal is measured, in the second, the refocused echo is measured. (<i>c</i>) The EPR spectrum in integral form for a nitroxide biradical with the positions of the observation and pump pulses along the field indicated, including the case of a ‘blank’ measurement in the three-pulse case (see text)."}}]](/storage/images/resized/r7Lgc3BhwNmQMbSFL5jcyds1GWc266TWS4r6MZ0R_xl.webp)
Later, when implementing a three-pulse circuit powered from a single electrical network and using a conventional resonator, it was discovered[34][35] that when the observation and pump pulses coincided in time, the echo signal was distorted. This distortion was most likely caused by a sharp change in the signal phase.[36]This effect was called the ‘dead time’ effect, by analogy with the well-known effect of resonator ringing after the action of microwave pulses, which prevents the observation of free induction and ESE signals immediately after this action. However, it should be noted that there is no actual analogy, and these are two different phenomena. Resonator ringing after the application of microwave pulse is a purely physical phenomenon caused by the impossibility of instantaneous attenuation of electromagnetic oscillations in the resonator after the termination of the microwave pulse. The distortion of the signal in DEER experiment when pulses overlap in time (a sharp change in its phase[36]) is either a technical problem of the imperfection of the devices due to the undesirable influence of two powerful pulse sources on each other (the so-called ‘electrical interference’) or the effect[37] of the non-resonant action of the pump pulse in a conventional (single-mode) resonator.
Since the commercial ESE/DEER spectrometers that subsequently appeared used only one electrical network for power supply and a conventional resonator, this problem of echo signal distortion when the observation and pump pulses coincided in time became common. It has been proposed[38][39] to eliminate this problem by adding another pulse to the echo-forming sequence for spins A and recording the signal from the resulting refocused echo instead of the primary echo signal (Fig. 1b). It turned out that in this measurement scheme, the refocused echo is not distorted as the pump pulse passes through the primary echo signal. This four-pulse sequence is currently considered standard.[7]
Then, however, a simple modification of the three-pulse DEER experiment was proposed,[36]which makes it possible to eliminate the ‘dead time’ problem on commercially available spectrometers. The modification consists of conducting an additional ‘blank’ comparison experiment, in which the pump pulse is applied outside the resonant absorption (see Fig. 1c), and then dividing the signals from the working and ‘blank’ experiments by each other. It was found that the signal distortion is eliminated after this division, which can be explained by the identical nature of the signal distortion in these two experiments.[40]
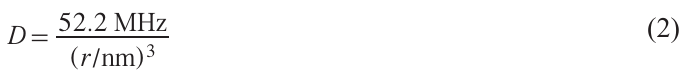
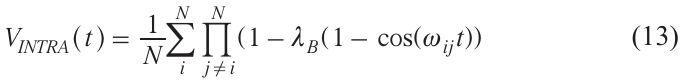
The results of a detailed comparison of the three-pulse and four-pulse DEER methods are shown in Fig. 2.[40] As can be seen, the data from the two methods do not differ much (some difference is due to the non-zero duration of the pulses and their different number).
![[{"id":"y_Al0zd_vt","type":"paragraph","data":{"text":"Comparison of the results of a three-pulse (3p) and four-pulse (4p) experiments for the biradical shown in the inset at the top right.<sup>40</sup> (<i>a</i>) The original measured signal as the ratio V(t)/V(0); for the 4p experiment, the value of V(0) is taken to correspond to that for the 3p experiment; the dashed line shows the exponential approximation of the intermolecular contribution for both experiments. (<i>b</i>) The resulting intramolecular contribution for both methods. The inset shows the distance distribution function. See text for all details."}}]](/storage/images/resized/PGmCwCsNHfNxF63BpErZCnfkMgDWg06x1DZZQzOA_xl.webp)
Fig. 2a shows that there is no gap in the data between the measurements at t < 0 and at t > 0. That is, the ‘dead time’ problem is indeed eliminated in this modified experiment. Of course, this signal distortion issue has nothing in common with the unavoidable problem of resonator ringing when observing free induction and ESE signals. Therefore, in our opinion, it is better not to use the term ‘dead time’ in DEER in order to avoid confusion between two fundamentally different phenomena.
When comparing the three- and four-pulse experiments, the following must also be taken into account. In the three-pulse setup, the pump pulse passes through the first echo-forming pulse, which creates difficulties in the theoretical description of spin dynamics, since the spins are simultaneously exposed to microwave fields of different frequencies. In the four-pulse setup, similar difficulties arise in the theoretical description of the primary echo at one frequency during the passage of a pump pulse at another frequency. Therefore, in both cases, the above-mentioned condition Dtр << 1 must be met; that is, the pulse durations must be sufficiently short.
The theoretical description of the DEER effect under the indicated condition is the same for the three- and four-pulse experiments. For the sake of clarity, we will consider the three-pulse experiment. Each spin in a solid is subject to inhomogeneous broadening, which gives it a specific individual resonant frequency ω0 . In a coordinate system rotating with the frequency of the alternating magnetic field ω, the phase acquired by spin A before the action of a 180° pump pulse at the frequency of spins B at time moment t < τ is (Dw0 ± 1/2 ωdd)t (here, Dw0 = ω0 – w, the sign ± is determined by the spin B projection). After this action, the d-d interaction changes sign so that ± changes to +–, and the acquired phase just before the second echo-forming pulse at the frequency of spins A at time moment τ takes on the value
At the moment 2τ of the echo signal formation, the phase acquires the value p +– wdd t (the disappearance of Dω0 here is an important property of the spin echo phenomenon), so the measured signal is proportional to cos wdd t. This result means the modulation of the signal when time t changes with frequency wdd, which allows us to measure the magnitude of the dipolar broadening wdd. Completely similar formulas also apply to the four-pulse experiment; in the notation of Fig. 1, time t just needs to be replaced with t'.
The time dependence of the measured DEER signal V(t) is determined by two contributions: the intramolecular contribution VINTRA(t), arising from the interaction of spin labels within the molecule, and the intermolecular contribution VINTER(t), arising from the interaction of spin labels in different molecules. These two contributions are assumed to be independent, so that V(t) is a product:

The intermolecular contribution VINTER(t) can be obtained from additional experiments with single-label molecules or estimated from the asymptotic behavior of V(t) at large t. Most often, it is approximated by a simple exponential (see also below).
Due to the large EPR linewidth, in real situations, only a fraction of the partner spins B is excited by the pump pulse. We denote this fraction by λB; it is called the excitation efficiency. Then, VINTRA(t) is determined by the expression:

(VINTRA(0) can be considered equal to unity without loss of generality). At large times t, the cosine in equation (5) oscillates rapidly and averages to zero:

Therefore, λВ is also called the modulation depth. The experimentally obtained dependence VINTRA(t) can be transformed into a normalized form:
with VN (0) = 1, VN (∞) = 0. Examples of normalized VN (t) were shown in Fig. 2b.
Except of obtaining the magnitude of the dipolar broadening, wdd , DEER method allows also studying the relative orientation of two spin labels, which is achieved by taking measurements for different frequency differences for the echo-detection pulses and the pump pulse.[7][27][41]
2.3. DQC, SIFTER and RIDME
A disadvantage of the DEER method is that it is only applicable to EPR spectra that are wide enough for the two frequencies ωA and ωB to be separated sufficiently. In the X-band, this typically means an EPR spectrum width of at least 2 mT. To overcome this drawback, various single-frequency PDS methods have been proposed.
In the DQC [8-10] method, a spin system in a magnetic field is exposed to a series of four or more microwave pulses with rotation angles of 90° or 180°. Unlike the DEER method, a simple vector model of the phenomenon is no longer possible; a density matrix approach is required for a theoretical description. For two spins, the density matrix has dimensions 4 × 4. In thermal equilibrium, before the pulses are applied, only the diagonal elements, corresponding to the populations of the four possible states, are nonzero. The energy splitting between the lowest and highest levels is approximately equal to two Zeeman quanta. Microwave pulses lead to the appearance of nonzero off-diagonal elements; the pulse amplitudes and phases are selected so that after the last pulse, an observable transverse magnetization signal appears, proportional to the coherence of the upper and lower levels. This coherence oscillates for spins A and B with a total frequency ωAdd + ωBdd (with a double frequency 2 ωdd for identical spins A and B), which is the basis for the application of the method.
The SIFTER [11][12] method is an analogue of the solid-state echo method in NMR. Compared to the basic solid-state echo pulse sequence in NMR, it adds two 180° pulses, which reduce the incomplete excitation effects of the EPR spectrum. The theoretical description of the effect here, as in the DQC method, is only possible using the density matrix formalism.
The advantage of both methods, DQC and SIFTER, compared to DEER is, as already mentioned, their applicability to narrow EPR spectra. However, when studying narrow lines, one serious problem arises, viz., the need to take into account the strong coupling between spins (when Δω2 ≤ω2dd) given by the pseudosecular terms in the d-d interaction Hamiltonian (equation (3)). This necessity can significantly complicate the interpretation of the data,[16] firstly, due to the complexity of the calculation scheme itself, and secondly, due to the fact that an additional parameter appears: the ratio of the EPR spectrum width Δω to the magnitude of the d-d interaction ωdd . A certain solution to this situation is the transition from the standard X-band EPR to EPR in high fields (Q-band, etc.).
RIDME method[13] is also single-frequency. It is based on the observation of the stimulated ESE signal in a three-pulse sequence, 90° – t – 90° – t – 90° – t – echo. Here, as in DEER, the theoretical description is simple and clear. Between the second and third pulses, spin B changes its orientation along the magnetic field due to longitudinal spin-lattice relaxation. The effect of this process on the stimulated ESE signal results in a contribution to the signal proportional to cos wdd t, similar to the other PDS methods. This provides information about the d-d interaction. The difference from the DEER, DQC and SIFTER methods is that in RIDME the effect arises from natural stochastic processes of spin relaxation, rather than from applied microwave pulses, so the advantage is the larger fraction of the excited B spins, which is independent of the EPR spectrum width of B spins. This advantage plays a decisive role in the case when this width is large: significantly larger than the available amplitude of microwave pulses.[14]
It is noted[5] that the simple multiplication of intra- and intermolecular contributions according to formula (4), valid for the DEER case, is not entirely justified for DQC and SIFTER methods. This fact complicates the application of these methods to the study of multi-spin systems. Some ways to overcome this difficulty were however indicated,[42] and analytical expressions for the DQC signal for a system with N dipolar-coupled spins were obtained.
2.4. Two-pulse electron spin echo (2-p ESE)
The ESE signal, on the measurement of which all PDS methods are based, in its simplest two-pulse version is also sensitive to the d-d interaction.[43] This was first shown experimentally a long time ago, in a study[44] of the pairs of SO4– radicals formed after UV photolysis of a potassium persulfate single crystal. The mechanism of this sensitivity is exactly the same as in the DEER experiment: the second pulse in the two-pulse sequence, in addition to its role of inverting the phase of the spin evolution necessary for the formation of the echo signal, also changes the sign of the d-d interaction — similar to the pump pulse in DEER.
Accordingly, the theoretical description[44] of the experiment is the simplest, leading to an analytical expression for the dependence of the ESE signal E(τ) on the time between two pulses τ. In the case of weak coupling, when Dw2 > w2dd , these expressions are reduced to a form completely analogous to formula (5) for the DEER signal:[23]

Here, instead of the efficiency of excitation λВ of spins B in a pair, the efficiency λА of excitation of the observed spins A themselves appears (the observed spins A and excited spins B here are the same). And instead of scanning time t in the DEER experiment, the 2p ESE experiment assumes scanning time τ.
The mechanism by which the ESE signal is sensitive to d-d interactions is called ‘instantaneous diffusion’,[43] since under the influence of microwave pulses, the d-d interaction in a pair of spins instantly changes sign (if we neglect the duration of the pulses). However, it should be noted that all effects in PDS are also based on the phenomenon of ‘instantaneous diffusion’ (in RIDME, the d-d interaction changes sign due to spin reorientation during spin-lattice relaxation). Therefore, using this term specifically for the 2p ESE method is not entirely appropriate, as it artificially separates this method from other PDS methods.
Implementing a simple 2p ESE method is complicated by several factors. First, there is the aforementioned ‘dead time’ phenomenon after the pulses are applied, during which measurements are impossible due to resonator ringing. Secondly, in addition to the d-d interaction, the ESE signal is also affected by various thermal processes leading to transverse relaxation, the contribution of which is difficult to take into account. Thirdly, magnetic nuclei in the surrounding environment (most often protons) interacts with unpaired electrons also via the d-d mechanism, resulting in the so-called Electron Spin Echo Envelope Modulation (ESEEM) effect, which can significantly mask the effects of the d-d interaction of electron spins.
In fact, to overcome all these difficulties in the simple 2p ESE method, the DEER, DQC and SIFTER methods were proposed, which are much more complex, both in experimental implementation and in theoretical description.
Nevertheless, 2p ESE has been successfully applied to a number of specific systems. Its use, as mentioned above, has proven exceptionally fruitful for spin-correlated radical pairs,[17-22] due to a number of favourable accompanying circumstances. First of all, for such pairs, the exact value of the echo signal amplitude at zero delay between pulses is known: it is simply zero because the cosine dependence on time t here is replaced by a sine dependence. This fact significantly reduces the severity of the dead time problem, since the rather vague problem of extrapolating a signal to zero time turns into a much more specific problem of interpolation. Then, for these radical pairs, the distances between two radicals (2 – 3 nm) are such that the influence of thermal relaxation on the signal decay due to d-d interactions is not so great. Then, the ESEEM effects are not as significant due to the spin polarization of the surrounding nuclei. Finally (and this is very important), the microwave pulses in these experiments had an amplitude large enough to excite the entire EPR spectrum.
For ordinary systems in thermal equilibrium, the 2p ESE method can also yield good results. This is achieved by measuring the time dependences of the signal obtained for two different excitation efficiencies and then dividing them by each other.[23] Firstly, the resulting ratio can be found for zero time in a number of cases:[45][46] that is, the extrapolation problem again is transformed into an interpolation problem. Secondly, division eliminates the problem of rapid transverse relaxation, since it manifests itself as an identical factor for the both time dependences. Thirdly, the ESEEM effects are also significantly reduced after division. And finally, the available microwave pulses in many cases make it possible to excite the entire EPR spectrum (or one of its components).[23][45]
For systems with a uniform distribution of nitroxide label spins, it has been shown that 2p ESE and DEER give consistent results.[47] This is not surprising given the above-mentioned similarity of the manifestation of the mechanisms of d-d interaction in the two methods.
2.5. Distance distributions
2.5.1. Biradicals
In biradicals and doubly spin-labeled molecules, due to the flexibility of the structure and delocalization of the electron density, the interacting spins A and B are not at a strictly defined distance from each other. Their mutual spatial distribution is characterized by the distribution function P(r). This function is normalized as . For a biradical, instead of equation (5), we write

where

Note that f (0) = 1.
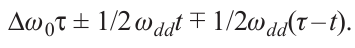
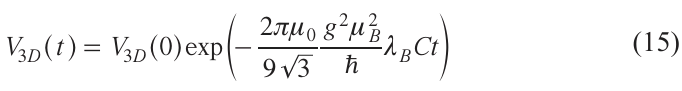
The theoretical function f (t) may be identified with the experimentally obtained normalized intramolecular contribution VN (t) (see equation (7)). An example of calculations using equations (9) and (10) of the functions VINTRA(t) for a biradical is shown in Fig. 3a. In these calculations, the function P(r) was assumed to be Gaussian with a maximum at a distance of 3 nm and a width of 0.075 nm.
![[{"id":"Bz1gmfwGD2","type":"paragraph","data":{"text":"(<i>a</i>) Calculated time dependences of the DEER signal for a 3 nm long biradical with a Gaussian distance distribution of 0.075 nm width for two different excitation efficiencies λ<sub>В</sub> (0.25 and 0.5). The dashed lines show the asymptotic limiting values at large times (dipolar modulation depth). (<i>b</i>) Fourier transform of these dependences, normalized according to equation (7) (the same for both λ<sub>В</sub>)."}}]](/storage/images/resized/CHdlzbE0WiZXds6e0g2PYbEnLaO2k6AzgfFZEimy_xl.webp)
The Fourier transform of (10) is written as
where the function

is the kernel of the integral equation (11). Note that F(n) is normalized, . For biradicals, F(ν) has the characteristic form shown in Fig. 3b, called the Pake resonance pattern or Pake doublet.[3-7]
For the Pake doublet, there are two narrow peaks symmetrical with respect to the zero frequency, which arise when the magnetic field of the spectrometer B is oriented perpendicular to the vector r connecting the two spins. The position of the peaks in frequency is determined with good accuracy by equation (2); this accuracy would be absolute for an extremely narrow distribution. The two peaks would then appear as two singularities (hereinafter, these peaks will be called singularities for any sufficient narrow distributions). In Fig. 3b, the maxima of the function F(ν) occur at frequencies of ± 1.74 MHz, hence from equation (2) we obtain r = 3.1 nm, which does not differ much from the true value of 3 nm.
Thus, a simple frequency-domain analysis of DEER data allows us to estimate the position of the maximum of the distance distribution function P(r) with good accuracy. The width of the distance distribution can also be estimated from the broadening of the maximum peak (using simple calculations for model distributions).[19][20]
Equations (10) and (11) in the time and frequency domains, respectively, represent Fredholm integral equations of the first kind for the function P(r). Solving these equations is an ill-posed problem: small fluctuations in the experimentally measured function VN (t) can lead to significant changes in the solution. This difficulty is overcome by imposing certain constraints on the solution, such constraints are called regularization. Currently, the most commonly used is the so-called Tikhonov regularization, where a constraint is imposed on the smoothness of the desired function.[48-50] Note that a number of other approaches to finding the function P(r) have also been proposed,[51-57] based on other regularization methods.
The author of this review prefers to use regularization by approximating the solution by a sum of Gaussian functions (multi-Gaussian approximation), with fitting the calculation results to the DEER spectrum in the frequency domain.[56] Gaussian distribution is very common in nature, so this approach has a quite solid basis. This regularization easily copes with the presence of a combination of narrow and wide peaks in the P(r) function (Tikhonov’s regularization has problems with this: it broadens narrow peaks and narrows wide ones). Furthermore, searching for a solution in the frequency domain allows us to reproduce the singularities of the Pake pattern, what is an important criterion for the correctness of the solution. Then, residual ESEEM effects are immediately visible in the frequency spectrum and can be easily removed. Finally, the multi-Gaussian approximation does not require the development of specialized software, as it can be easily implemented by a researcher with some knowledge of computational mathematics and minimal programming skills. This independence from standard software allows the calculation scheme to be easily modified for any change in the measurement scheme, for example, when taking into account dead-time effects in 2p ESE.[23]
2.5.2. Nanoclusters, multi-spin effects
For a nanocluster of N molecules, in the case where the pump pulse excites several spin partners B at once, equation (5) must be multiplied to take into account all pairs of spins in the cluster, with subsequent averaging of the result:
From this equation it follows that when t → ∞

This limit is easily measured in an experiment, and from it one can obtain the number N of particles in a cluster.
If the task is to find the distribution functions P(r) between different spins in a cluster, the approach described above for biradicals can be used. It is also necessary to keep in mind the appearance of so-called multi-spin effects in DEER, which arise due to the multiplication of cosines in equation (13) and the resulting appearance of combination frequencies. It follows from equation (13) that multi-spin effects should be small at low lB.[58][59]
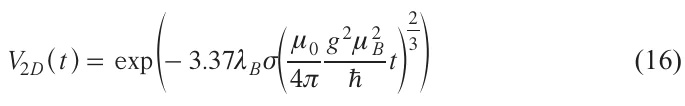
The manifestation of multi-spin effects in DEER can be illustrated by comparing the data for a biradical and a triradical in the form of an equilateral triangle with the same side length as in the biradical (this approach was proposed in studies[58][59]). Indeed, in both cases, all distances are identical, but in the first case, multi-spin effects are absent. The results of such calculations performed by the author of this review using formulas (1) and (13) for the time dependences of the DEER signal and the Fourier transform of the normalized functions VN (t) of these dependences (see (7)) are presented in Fig. 4. Calculations were performed for the biradical distance and the equilateral triangle side length, both equal to 3 nm, and for two λB values (0.25 and 0.5), which lie in the range of those most commonly used in real experiments for nitroxides. In these calculations, the positions of the spin label were distributed according to a Gaussian law with a width of 0.075 nm.
![[{"id":"iHbLBMdCfC","type":"paragraph","data":{"text":"(<i>a</i>) Calculated time dependences of the DEER signal for a 3 nm long biradical (similar to Fig. 3 a) and an equilateral triradical with the same side length of 3 nm, for two different excitation efficiencies λ<sub>В</sub> (0.25 and 0.5). The dotted lines show the asymptotic limiting value at large times. Fourier transforms (<i>b</i>) are obtained for normalized signals V<sub>N</sub> (t); the data for λ<sub>В</sub> = 0.25 are shifted upward for clarity of presentation. Arrows correspond to the doubled frequency of the singularity positions in the spectrum (see discussion in the text)."}}]](/storage/images/resized/rxKoTKtNrvumdWVFurG6DMonH5BKkJgWkENTfbxd_xl.webp)
From Fig. 4a, it is evident that the dipolar modulation depth shown by the dashed lines increases with increasing λB and that this depth is consistent with formula (14). From Fig. 4b, it follows that singularities also arise for the triradical, and at the same frequencies as for the biradical. Singularities for the triradical obviously arise when the magnetic field B is oriented in one of the three planes perpendicular to the three sides of the triangle.
At a small λB = 0.25, the Fourier spectra for the biradical and triradical (see Fig. 4b) are almost identical, which means that multi-spin effects are small. However, as λB increases to 0.5, the two spectra begin to differ, primarily at their edges, around the doubled frequencies for the singularity (shown by arrows). This is obviously due to the influence of combination harmonics, i.e., multi-spin effects. It is interesting to note that exact frequency doubling should occur for vector B, which lies along the intersection line of the three aforementioned planes. The nature of this doubling is easy to understand: for N = 3 and θ = π/2, a term proportional to cos2Dt appears from formula (13). This appearance of additional peaks in the Fourier transform should lead to the appearance of a false or ‘ghost’ peak for the distribution function P(r) at a distance smaller by 3√2 times the distance for the ‘true’ peak in P(r).
The calculation results for other polygons: a square, a regular pentagon and a regular hexagon, inscribed in a circle with the same radius of 2 nm, are shown in Fig. 5. To minimize multi-spin effects, a small value of λB = 0.14 is used in the calculations. The calculations were performed for spin labels located exactly at the vertices of the polygons; exponential apodization with a time of 0.5 μs was then applied to the obtained signals in the time domain.
![[{"id":"768XYbCMu-","type":"paragraph","data":{"text":"(<i>a</i>) Calculated time dependences of the DEER signal V<sub>INTRA</sub>(t) for a square, a regular pentagon, and a regular hexagon in scribed in a circle with a radius of 2 nm (λ<sub>B</sub> = 0.14). (<i>b</i>) Fourier transforms of the corresponding normalized dependences V<sub>N</sub> (t); the data are shifted vertically for clarity of presentation."}}]](/storage/images/resized/opfUjKQ25WbgsZ8DjaOqWnpgcHAtzhDLM0qkeGBt_xl.webp)
From the data in Fig. 5a, it can be concluded that here is also a good agreement between the asymptotic value of VINTRA(t) for large t (modulation depth) and formula (14). For the Fourier spectra in Fig. 5b, all spectra show only 2 clearly visible peaks in each of the positive and negative frequency ranges (2 pairs of symmetrical peaks). According to formula (2), the low-frequency peaks between ± 0.60 and ± 0.80 MHz correspond to r ≈ 4 nm, i.e., the diameter of the circle or the total size of the system. The high-frequency peaks, as is easily seen, correspond to the minimum distance between the spin labels. Indeed, for a square, the frequency of these peaks, ± 2.11 MHz, according to equation (2), corresponds to a distance of 2.91 nm, which is close to the length of the side of the square of 2.83 nm. For a pentagon, these frequencies are ± 3.84 MHz, with the resulting distances being 2.27 nm that is close to the pentagon side length of 2.35 nm. For the hexagon, these peaks are at a frequency of ± 6.3 MHz, for which, according to equation (2), r = 2.02 nm is obtained, which corresponds with good accuracy to the length of the sides of the hexagon (2 nm). The intermediate frequency peaks corresponding to intermediate distances are superimposed on the sharp decline from the central peak and are therefore practically invisible. From this we can conclude that for N > 3, two peaks are clearly observable in each frequency region: the peak at low frequency roughly corresponds to the size of the system, and the peak at high frequency corresponds to the smallest distance between the spins.
For clusters in biological systems, one can hardly expect a regular geometry of the relative arrangement of spin labels. A more adequate model would be one that includes an element of randomness in such arrangements. Fig. 6 shows the calculation results for a hexagon of 2 nm radius in which the spins are randomly distributed around the circumference. Here, only peaks remain at low frequencies, namely ± 0.85 MHz. The presence of this peak is explained by the fact that the circle diameter is the only allocated distance in this model.
![[{"id":"AtYe7XKjts","type":"paragraph","data":{"text":"(a) Calculated time dependences of the normalized DEER signal V<sub>N</sub>(t) for a hexagon inscribed in a circle with a radius of 2 nm and a random distribution of vertices, for the specified values of λ<sub>B</sub>. (<i>b</i>) Fourier transforms of these dependences."}}]](/storage/images/resized/t2nwsjOtcgmjc92pOFNyKeCLJCmOWrmDLxLoLBoF_xl.webp)
In order to clarify the influence of multi-spin effects on the DEER of nanoclusters with a large number of spin labels, the author of this review carried out calculations for different λВ values. The results are also presented in Fig. 6. It can be seen that although λВ varies over a fairly wide range, almost an order of magnitude, these results depend on λВ weakly and the cluster size can be judged virtually without regard to this parameter. The reason for this is quite clear: the combination frequencies, due to their wide spread, only broaden the lines without changing their positions. The weak dependence on λВ was also noted above for the equilateral triangle (see Fig. 4).
It is also evident from Fig. 6b that as λВ increases, the splitting in the centre is smoothed out. This, of course, occurs due to the presence of combination frequencies. Similar smoothing can also be expected for small λВ in the case of a distribution by the diameter of the circle used in the calculations.[59] This smoothing, of course, does not affect the possibility of determining the size of the system from the DEER data: this size can be estimated simply from the peak width (for example, at half-height), which is weakly affected by λВ (see Fig. 6b). A comparison of Fig. 6b with Fig. 5b for a hexagon shows that the presence of combination frequencies and the distribution of positions do not significantly affect the peak width at its base (approximately from –8 to 8 MHz).
From the data in Fig. 5a for the modulation depth and the data in Fig. 6b for the Fourier transforms, it can be concluded that for nanoclusters, the reliably measurable quantities are the number of particles in the cluster N, the total size of the nanocluster, and the characteristic distance between the particles in it.
The conclusion drawn from the analysis of the Fourier spectra about the only small influence of multi-spin effects means that the choice of small λВ is generally not so important for obtaining the necessary information. This is in accordance with the view expressed in the literature[58] that the contribution of multi-spin effects is most noticeable only for highly symmetric and relatively rigid systems, while they can often, but not always, be negligible in asymmetric systems.
It should also be noted that the DEER of nanoclusters may exhibit rather specific effects, for which the general formula (13) is no longer sufficient. A detailed discussion of these effects is provided below in Subsection 3.3.5.
2.5.3. Uniform spatial distributions
From formula (13), the intermolecular contribution VINTER(t) can be obtained if the geometry of the relative positions of the spins is known. For the case of a uniform spatial distribution of spins in 3-dimensional space, the following equation holds:[1-7]
where С is the volume spin concentration.
For biological membranes, it is natural to assume a 2-dimensional distribution. The analogue of formula (15) for a uniform distribution of spins in a plane and for an equally probable direction of the magnetic field relative to this plane is the formula:[60]
where s is the surface concentration.
Let us also consider the case of a regular spin arrangement in a plane. Calculations here are also carried out by formula (13). For a regular two-dimensional hexagonal lattice with different parameters a, the results are presented in Fig. 7.
![[{"id":"_N-qVIdhUK","type":"paragraph","data":{"text":"Calculated time dependences of the DEER signal for a regular hexagonal lattice with the indicated different parameters a. The excitation efficiency λ<sub>В</sub> = 0.1. The dashed line corresponds to the case of a Gaussian distribution of the spin positions relative to the lattice sites with a standard deviation of 0.4 nm."}}]](/storage/images/resized/dYHGJjEjvNxx83CRSIsP8myHferG0ETzvAyRmHYP_xl.webp)
Note that for the data presented in Fig. 7, at small times t, from the expansion of the cosines in equation (13), one can obtain a simple quadratic time dependence of the form

is the second moment of the frequency distribution of the d-d interaction. This type of functional dependence significantly distinguishes the regular spatial distribution at small times t from the cases of uniform random distribution (cf. equations (15) and (16)). Note that the uniform distribution allows for very small distances between spins, leading to an infinite second moment.
3. Research results
3.1. Synthetic oligomers
Specially synthesized nanometer-sized oligomers with known structures were used in a number of studies to test the applicability of PDS methods. The most commonly used method was the four-pulse DEER. Data on the distances between spin labels and their distributions were obtained from the found time dependences of the function VN (t) which were analyzed employing Tikhonov regularization, mainly using a specially designed software tool.[48]
In a work,[61] symmetrical and asymmetrical triradicals, as well as a tetraradical, specially synthesized on the basis of nitroxide monoradicals, were studied. Two biradicals were synthesized for comparison. The measurement yielded the expected distances (2.2 – 3.8 nm) for all of these compounds, with an accuracy of ± 0.5 nm. The number of spins N, found using formula (14), was 2.1 for both biradicals, 3.1 and 3.0 for the symmetric and asymmetric triradicals, and 3.9 for the tetraradical (i.e., the error in determining N is no more than 3%). Multi-spin effects were not considered in this study.
In a work,[62] similar systems were also studied: triradicals with the geometry of equilateral, isosceles and scalene triangles (the lengths of the sides range from 3.2 to 4.2 nm). Here, the attention was drawn for the first time to the fact that in multi-spin systems, contributions to the signal from sum and difference combinations of dipolar frequencies can arise, which leads to artifacts in determining distances in the form of additional false peaks (subsequently called ‘ghost’ peaks).[58]Interestingly, it turned out that for an equilateral triradical, the false peak actually appears at a distance 3√2 times smaller than the ‘true’ one; see Subsection 2.5.2 (although this fact is not noted in this publication). It has been shown that these artifacts can be taken into account in experiments with variable pump pulse efficiency λВ by changing the pulse duration: the shorter the duration and, accordingly, the pump efficiency, the less the influence of artifacts.
In a follow-up study,[58] DEER of multi-spin systems was considered in more detail. To suppress multi-spin effects (false or ‘ghost’ peaks), an approximate ‘power scaling’ procedure was proposed in the data analysis, by raising the function VINTRA(t) to the power ζN = 1/(N – 1). This approach does not require a reduction in λB . It was tested through computer simulations for cases of multimers with two to five spins, with interspin distances from 3 to 7.5 nm. It was shown that suppression of multi-spin effects works well for symmetric geometries and rigid molecules. For N > 4, a combination of decreasing λВ and ‘power scaling’ is recommended. Multi-spin effects in DEER were also discussed in the paper,[59] where it was proposed to take multi-spin correlations into account based on a direct calculation of the DEER signal.
DEER methods in the X- and Q-bands of EPR frequencies were applied to a synthetic oligomer of tetrahedral structure with nitroxides at four vertices and, accordingly, with four identical interspin distances of 3.7 nm.[63] It turns out that for this tetrahedral system, the ‘1/ 3√2 rule’ formulated in Section 2.5.2 for the position of the false peak also works (although this is not noted in this paper). To reduce artifacts due to multi-spin effects, both a reduction in λВ and a correction procedure for the experimental data using the above-mentioned ‘power scaling’ were used. A recommendation is given for the combined use of both approaches, subject to the condition λВ < 1/(N – 1). An alternative way to reduce the influence of multi-spin effects by rearranging the positions of the pump and echo-forming pulses in the EPR spectrum is also indicated.
The capabilities of DEER of nitroxide spin labels in the Q-band of EPR frequencies were studied[64] to determine the number of spin labels bound in oligomers. For this purpose, specially synthesized molecules with the number of spin labels from 2 to 6 and with inter-label distances from 3 to 5 nm were used. Due to the wide width of the EPR spectrum in the Q-band, the λB value was quite small, around 0.1, which allowed to avoid the multi-spin effects. The DEER method was shown to be potentially applicable to all these systems.
It was also found[64] that the intensity of the primary ESE signal decreased strongly with increasing number of bound spins N. This decrease was explained by the influence of the d-d interaction in the system of observed spins A, which arises when more than one spin is excited. This effect has been previously discussed in theoretical papers,[65][66] from the results of which it can be concluded that with decreasing time τ (or τ' ) and with λA < λB , this influence also becomes small.
In addition to the widely used nitroxide spin labels, spin labels based on trityl radicals have recently come into use. A systematic evaluation of the efficiency of various PDS methods (DEER, RIDME, SIFTER and DQC) for measuring interspin distances using trityl labels in Q-band EPR was conducted.[67] In this study, two bistrityl molecules and one tristrityl molecule are used as model systems. The tristrityl molecule (a nearly equilateral triangle with sides of approximately 3.5 nm) allowed to study the influence of multi-spin effects. Due to the narrow EPR signal of trityl and, as a consequence, the high efficiency of microwave excitation λВ , the observed effects of d-d interaction turned out to be significantly stronger than in nitroxide under otherwise identical conditions. On the other hand, a larger value of λВ in the case of a tristrityl system leads to significant multi-spin effects, also observed in DEER and in the SIFTER and DQC methods. The application of the RIDME method to systems with one type of spin label (trityl in this case) and a narrow EPR spectrum in this work was considered unjustified (which does not exclude the possibility of its use in the case of wide EPR spectra).
Thus, based on the results of studies of synthetic oligomers of known structure, it can be stated that DEER does indeed allow obtaining useful structural information about nanosized oligomers. These results are generally consistent with the theoretical description presented in Section 2.5.2. However, it is necessary to take into account the complicating factor of the interaction of the spins of A with each other which is not described by the fundamental equation of the theory (13). This important issue is discussed in detail below, in Subsection 3.3.5.
3.2. Oligomers in protein systems
The protein systems studied used spin labels based on (1-oxyl-2,2,5,5-tetramethyl-3-pyrrolin-3-yl)methylmethanethiosulfonate (MTSSL), which attach selectively to the thiol groups of specially prepared cysteine mutants of the protein systems studied (the so-called site-directed spin labeling).
In all cases, the four-pulse DEER method was used, and data on the distribution of distances between spin labels P(r) were obtained using Tikhonov regularization for the time dependences of the function VN (t).[48] A number of studies of oligomers in protein systems have been performed for objects with geometry already known from crystallographic data. That is, these studies, as well as the works on the study of synthetic oligomers described in the previous subsection, are primarily of a methodological importance.
In work,[68] tetramers of the potassium ion channel KcsA were studied. The obtained distance distribution functions have maxima at 2.2 and 3.1 nm. Carrying out measurements for different frequency differences for the echo-forming pulses and the pump pulse allowed to draw conclusions about the relative orientation of the spin labels in the tetramer. It was found that the spin labels are oriented at an angle of 65° relative to the central axis of the channel.
The rod-shaped bacterium Escherichia coli contains as its main component the translocation channel Wza, an octameric outer membrane protein with a molecular mass of 320 kDa and a known closed-state crystal structure. A spin-labeled analogue of this system was prepared.[69] Eight labels in a regular octamer have four distances between them. The found P(r) functions for two protein modifications have maxima between 2 and 6 nm. This result, which the authors termed a ‘distance fingerprint’ of the studied system, is in good agreement with the characteristics of the crystal structure obtained from X-ray scattering data and provides a basis for studying conformational changes during interactions with partner proteins.
A heptameric mechanosensitive channel in the low-conductance biological membrane (MscS) opens in response to increased bilayer tension and thus performs a critical function in E. coli. The data obtained for this system (distribution maxima at distances from 2 to 6 nm)[70] were in agreement with the expected distances for the open crystal structure model of MscS. This led to the conclusion that DEER is an adequate experimental tool for studying the conformation of transmembrane regions of integral membrane proteins.
A spin-labeled mutant of the heptameric mechanosensitive channel MscS from E. coli was studied.[59] In general, the results showed good agreement between the experimental time dependences VINTRA(t), the obtained distribution functions P(r) and the corresponding calculations for the heptagon model.
These data[70] were also analyzed[59] using the direct time-domain DEER data calculation approach. It was concluded that this approach allows for reliable extraction of distances from experimental data on a heptameric membrane protein.
The GroEL molecular machine, consisting of 14 identical subunits organized into two heptameric rings stacked on top of each other, was studied in the Q-band EPR.[71] The experiments were conducted using deuterated protein and a solvent, which allowed the dipolar evolution time to be increased to approximately 80 μs and, accordingly, the range of distances studied to 17 nm. It was shown that the influence of multi-spin effects can be reduced by using ‘sparse’ spin labelling, which is another way to suppress artifacts associated with such effects. The measured distances (maxima were found from 3 to 16 nm) are consistent with the known crystal structure of this system. This study also presents data obtained at different delays between echo-forming pulses τ', and a significant dependence of the results on this delay was found. This effect, which is rather non-trivial from the point of view of the general principles of the functioning of the DEER, is discussed below in Subsection 3.3.5.
In other studies, DEER has already been used to elucidate the unknown nanostructure of biosystems and its changes during various biochemical processes. In a work,[72] the mechanism of self-association of the chemotactic kinase CheA was investigated. This protein forms signalling clusters with chemoreceptors and the binding protein CheW in bacterial cells. DEER showed that CheA aggregates through interactions mediated by its regulatory (P5) domain.
The M2 transmembrane domain of the influenza A virus functions as an oligomeric proton channel in lipid membranes. The DEER study of the mechanism of its assembly [73] showed that this domain exists in the form of monomers, dimers and tetramers, the relative population of which shifts towards tetramers with increasing peptide-to lipid molar ratio (P/L; hereinafter, all ratios are given as molar ratios). For the same domain, the structural response to the drug amantadine was also studied using DEER.[74] It was found that amantadine shifts the oligomer equilibrium toward tetramers.
Tau protein is an intrinsically disordered protein whose physiological function is to stabilize microtubules, which are part of the cytoskeleton of protein intracellular structures. Self-assembly of tau protein into fibrillar cellular inclusions is associated with a number of devastating neurodegenerative diseases. The mechanism of this self-assembly remains unclear, primarily due to the lack of data on the earliest stages of aggregation. The DEER method detected an enlargement of one of the key protein domains already at the earliest stages of aggregation, long before fibril formation.[75] This fact allowed the authors to make some assumptions about possible ways of therapeutic influence on this process.
Studies[76][77] examined the structure and function of the viral protein U (Vpu), encoded by human immunodeficiency virus type 1 (HIV-1). Vpu is a key HIV-1 protein that promotes viral adaptation and proliferation. The DEER method revealed the formation of stable oligomers (dimers, trimers, etc.) of MBP-Vpu in solution, apparently due to self-association of the Vpu transmembrane domain. It was also found[77] that the temporal dependence of the DEER signal intensity V(t) is significantly affected by the pulse separation time τ'. This is interpreted as a consequence of the fact that with a large number of spins in the oligomer, a significant decrease in the signal of the observed spins A occurs due to d-d interactions between them.
Note that a similar effect of signal intensity dependence on τ' can also arise if only two spin labels are attached to the protein.[78] In this work, this unusual dependence was interpreted as a difference in local environmental influences on the spin label phase memory relaxation time T2. It was concluded that quantitative interpretation of DEER data requires conducting a series of measurements at different τ' values followed by extrapolation of the results to τ' = 0.
It is interesting to note that in most of the above-described cases of studying oligomers by DEER in protein systems, the resulting P(r) function contained only two maxima. This is consistent with the analysis of model systems conducted above in subsection 2.5.2, for which it was concluded that the DEER Fourier spectra show only two clearly visible peaks (two in each of the positive and negative frequency ranges, i.e., a total of four).
3.3. Guest molecules in lipid membranes
As mentioned above, the lipid bilayer that forms biological membranes is approximately 5 – 7 nm thick, meaning it is a nanoscale system per se in the direction normal to the membrane. Below we show that guest molecules in membranes can form clusters of limited size, down to nanometers, also in the lateral directions.
3.3.1. Antimicrobial peptides
Due to the growing resistance of pathogenic bacteria to existing antibiotics, it is necessary to search for new types of drugs for which such resistance is absent or at least reduced. Among potential candidates for this critically important public health task, antimicrobial peptides (AMPs) are of particular importance, as they are known to have a low risk of addiction. AMPs are a diverse group of molecules that are naturally produced in various species of invertebrates, plants, and mammals.[79] Their amino acid composition allows them to penetrate bacterial cell membranes.
It is known that while P/L ratio in the membrane is low, AMPs are adsorbed onto the membrane surface and are located parallel to its plane, usually at the boundary between the hydrophilic heads of lipids and their hydrophobic tails (Fig. 8).[79][80]
![[{"id":"vDoMGw5wD-","type":"paragraph","data":{"text":"Schematic representation of the adsorption of AMP (red cylinders) on the membrane surface.<sup>80 </sup>Published under a Common Creative License."}}]](/storage/images/resized/cHgcpBy1ucw5HRvNLfRiBo239yL34YhnKa7pVg4h_xl.webp)
As the P/L ratio increases, AMPs can aggregate and/or reorient within the membrane. This leads to the formation of pores in the membrane, which are described within one of four proposed models: barrel-stave, toroidal, aggregate, and carpet (Fig. 9).[80]
![[{"id":"g4QDvsV85f","type":"paragraph","data":{"text":"Models of AMP (red cylinders) formation in the membrane: (<i>a</i>) barrel-stave, (<i>b</i>) toroidal, (<i>c</i>) aggregate, (<i>d</i>) carpet.<sup>80</sup> Published under a Common Creative License."}}]](/storage/images/resized/TVjCvfGYBSBKG282sYdimcbNTQKFaCdizAkALhec_xl.webp)
These models suggest that AMPs can kill bacteria by disrupting the integrity of their membranes. This mechanism of AMP action differs from that of conventional antibiotics, which typically affect various biochemical processes within the cell, such as the synthesis of proteins, DNA or cell wall. Since the interaction between AMPs and the membrane is non-specific, through hydrophobic and electrostatic forces, the likelihood of developing resistance to AMP action should indeed be low.
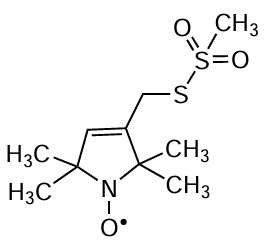
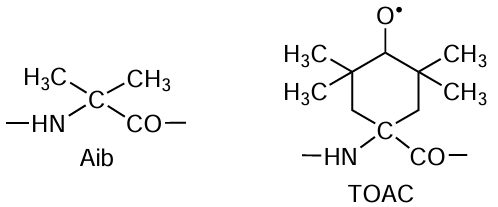
Among the various types of AMPs, a special class can be distinguished called peptaibols.[26][81][82] Peptaibols contain several residues of non-proteinogenic α-aminoisobutyric acid (Aib) and 1,2-amino alcohol at the C-terminus in their sequences. Peptaibols effectively interact with phospholipid membranes, causing their permeability. The carpet and barrel mechanisms are generally considered to be the primary mechanisms for membrane permeability. Peptaibols are convenient for spin labeling in chemical synthesis. For this purpose, Aib residues are replaced with structurally similar nitroxide spin labels 2,2,6,6-tetramethyl-N-oxyl-4-amino-4-carboxylic acid (ТОАС).[83] It was found that with such a replacement, the peptides do not lose their antimicrobial properties.[84]
The formation of pores in the membrane means the appearance of AMP associates in the form of their oligomers (AMP molecules are in direct contact with each other) or nanoclusters (the association of AMP molecules is mediated by lipids). Thus, DEER is a natural choice as a method for studying the self-association of AMPs, which has actually been used to study the self-association of AMPs in model lipid membranes. The main results of these studies up to 2015 are summarized in a review[26] that analyzes data for six types of natural peptaibols: trichogin GA IV, tylopeptin B, heptaibin, ampulosporin A, zervamycin II A, alamethicin and also an artificially synthesized covalent dimer of trichogin GA IV.
It should be noted that the experimental approaches used in these studies differed somewhat from those described above for synthetic oligomers and oligomers in protein systems. Firstly, in most cases, three-pulse DEER was used. Secondly, to find the distribution function, the authors used their own numerical methods (based on Tikhonov regularization).[50] Thirdly, the DEER data were supplemented with ESEEM experiment data for membranes hydrated with deuterated water: this approach allows conclusions to be drawn not only about the association of peptides, but also about the depth of their immersion in the membrane.[85] Fourthly, in some cases, doubly labeled peptide analogues were used in combination with the original unlabeled compounds, which allows conclusions about changes in the conformation of peptides during their aggregation. As a result of the application of all these methodological approaches, supramolecular models of the structure of associates (oligomers, nanoclusters) of the studied peptides were constructed.[26]
In particular, a spin-labeled analogue of the AMP alamethicin (Alm), Ac-Aib-Pro-Aib-Ala-Aib-Ala-Gln-Aib-Val-Aib-Gly-Leu-Aib-Pro-Val-Aib-Aib-Gln-Gln-Phol (Ac is acetyl, Phol is phenylalaninol), in which the TOAC spin label replaces the Aib residue at position 1 or 16 of the peptide, was studied in the egg L-α-phosphatidylcholine (ePC) model membrane.[86] For P/L ratios from 1/70 to 1/160, these studies concluded that Alm associates as tetramers (or lipid-mediated clusters of four Alm molecules).
A later study [87] reported data on spin-labeled Alm analogues in a model membrane at a P/L ratio in a wide range of values from 1/1500 to 1/100. The results showed that self-assembly of Alm molecules begins with dimer formation, already at very low concentrations (1/1000). Simultaneously with the formation of the dimer, the peptides change their orientation from intramembrane to transmembrane (ESEEM data). Further, as the P/L ratio increases, peptides assemble into higher-order associates, which may even include pentamers and larger associates (Fig. 10), likely representing membrane channels. That is, in this case, a barrel-type pore formation model is in effect (cf. Fig. 9a).
![[{"id":"pbHTu8nhTl","type":"paragraph","data":{"text":"Top view of Alm peptides in the membrane: transformation from dimers to pentamers with increasing P/L. Spin labels replacing either Aib<sup>1</sup> or Aib<sup>16</sup> are shown (red and blue, respectively).<sup>87</sup>"}}]](/storage/images/resized/f7c0gSfffQtQnNHpZqodt0n9U65MJDfmZs0UVE7K_xl.webp)
The distribution of distances between labels found from the DEER data (Fig. 11) becomes more clearly defined with increasing P/L (with peaks near 2.3 and 3.3 nm, which is consistent with previous results[86]) and suggests a more clearly defined structure in larger oligomers. A quite obvious conclusion was made that in the case of equilibrium between associates with different numbers of molecules, a detailed study of the dependence of the DEER data on the peptide concentration is required.
![[{"id":"mKGTvyDhtP","type":"paragraph","data":{"text":"Distribution functions of the distances between spin labels in clusters of Alm, replacing Aib<sup>1</sup> (top) and Aib<sup>16</sup> (bottom).<sup>87</sup>"}}]](/storage/images/resized/ZMYAZQkBhwOoWtittGvsaChgbjJUELrjEgkCKEcx_xl.webp)
Note that the distribution functions in Fig. 11 are in agreement with the analysis carried out in Subsection 2.5.2: for multi-spin associates, two well-resolved peaks are observed, corresponding to the minimum (or characteristic) distance between the labels and the total size of the associate. The additional third peak for Alm1 at its high concentrations of 1/170 is apparently due to the favourable geometry of the spin labels in this case (i.e., for which another distance is clearly distinguished); this was also suggested in Subsection 2.5.2.
A concentration dependence study was conducted for peptaibol trichogin GA IV (10 amino acids in sequence) during its self-association in the lipid membrane in the range of peptide concentrations P/L from 1/200 to 1/30.[88] It was found that when the critical P/L value of approximately 1/50 is exceeded, peptide dimerization begins. ESEEM data for bilayers hydrated with D2O showed that dimerization is also accompanied by a reorientation of the peptide to a transmembrane position.
For spin-labeled peptaibol tylopeptin B (14 amino acids) in a model membrane, DEER data were obtained at very low peptide concentrations, starting from P/L = 1/1500.[89] It was shown that self-assembly of the peptide begins already at a concentration of 1/1000; at a concentration above 1/500, the average number of peptides in a cluster <N> = 3.3. Using the ESEEM effect, it was found that tylopeptin B molecules have a planar orientation in the membrane. DEER data show that in the P/L ratio range of 1/1000 to 1/500, peptide clusters tend to repel each other, with a region of inaccessibility of approximately 20 nm. It is hypothesized that within this region, the peptides destabilize the membrane, thereby providing the antimicrobial activity.
Cationic antimicrobial peptides PGLa and magainin 2 (Mag2) are known not only for their antimicrobial activity, but also for the synergistic enhancement of this activity when used together. The molecular mechanism of this synergism is still unknown. Spin-labeled PGLa and Mag2 have been studied in lipid membranes.[90] In contrast to peptaibols, for PGLa, the TOAC label replaces the amino acid valine, while in Mag2 it is attached to the N-terminus. CW EPR and DEER data showed that both peptides are prone to aggregation with intermolecular distances of the order of 2 nm, which occurs already at a low P/L ratio of 1/1500. In the presence of a synergistic partner peptide, homo-aggregates of these peptides are converted into hetero-aggregates. ESEEM data indicate that in homo-aggregates of Mag2 and PGLa, significantly different depths of immersion of the corresponding labels into the membrane are observed, while in hetero-aggregates these depths are equalized. It is concluded that the supramolecular structure of hetero-aggregates may be important for their antimicrobial activity. Possible self-organization models are shown schematically in Fig. 12.
![[{"id":"PkZ6DNvCDH","type":"paragraph","data":{"text":"Possible models of self-organization of the PGLa and Mag2 peptides in lipid membranes. The membrane is viewed from the normal direction to its surface; the peptides are represented by blue cylinders, and the lipid head group is represented by red spheres. The scale is shown by the green circle with a diameter of 8 nm.<sup>90</sup>"}}]](/storage/images/resized/nctsH7LdPxTQKLvRv6Nel2hPAr1EVbuFBYA39a62_xl.webp)
In conclusion of this Subsection, it can be said that DEER is an adequate research tool for studying the behaviour of antimicrobial peptides in biological membranes due to their tendency to form nanosized aggregates (oligomers or clusters). A useful complementary method is 2H ESEEM spectroscopy in deuterated water,[85] which allows one to estimate the depth of peptide membrane insertion. For dense clusters, in the case of closely spaced (< 1.5 nm) spin labels, conventional CW EPR also provides useful information.[26]
3.3.2. Cholesterol analogues and lipid rafts
A key property of lipids is their self-assembly into two-dimensional liquid-crystalline biological membranes through electrostatic and hydrophobic interactions in an aqueous environment. For a long time, it was believed that the two-dimensional phase they formed was homogeneous. However, there is now increasing evidence that biological membranes undergo lateral liquid-liquid separation into more ordered and less ordered phases.[91-94] The more ordered phase is called lipid rafts.
Lipid rafts are thought to be ‘small (10 – 200 nm), highly dynamic, sterol- and sphingolipid-rich domains’.[93] The functions of lipid rafts may include localization and coordination of cellular processes, influence on membrane fluidity, acting as platforms for membrane proteins, receptors and signaling molecules, and regulation of neurotransmission.[91-94]
Phase separation is also observed in model cholesterol-containing lipid bilayers when they consist of a combination of fully saturated and unsaturated lipids. This separation is explained by the fact that the flat structure of the rigid sterol core of cholesterol favours interaction with the elongated hydrocarbon chains of more ordered saturated lipids and prevents interaction with the bended chains of less ordered unsaturated lipids. This resulted that a denser, structurally ordered phase, designated Lo, coexists with a looser, disordered phase, designated Ld (Fig. 13); the domains of the ordered phase in model membranes are also referred to as lipid rafts.
![[{"id":"jxcyNyHWLH","type":"paragraph","data":{"text":"Schematic representation of a model lipid membrane with phase separation into a more ordered (L<sub>o</sub>) and less ordered (L<sub>d</sub>) phases.<sup>91</sup> The Lo phase is dominated by lipids with less curved tails (blue); it also has an elevated cholesterol concentration (green). The L<sub>d</sub> phase is dominated by lipids with more curved tails (red) and contains less cholesterol. Published under a Common Creative License."}}]](/storage/images/resized/f64qDxIfXMqNeLPkUK6jS5tKUDlqYZsdWJaxHrSp_xl.webp)
There is not much direct experimental data on the molecular structure of rafts due to their small size and highly dynamic nature. Moreover, debate continues about their properties, composition, and even their very existence.[94] It should be noted that, due to the complexity of experimental research, computer modeling methods are becoming increasingly important.[95-98]
PDS methods may prove to be a promising experimental approach for studying membrane nanoscale heterogeneities due to their sizes. The problem of the highly dynamic nature of heterogeneity in these methods is lifted by the use of cryogenic temperatures. An important point here is that studies using low-frequency Raman scattering[99] have shown that when lipid bilayers are frozen, the lipid rafts in their structure are preserved.
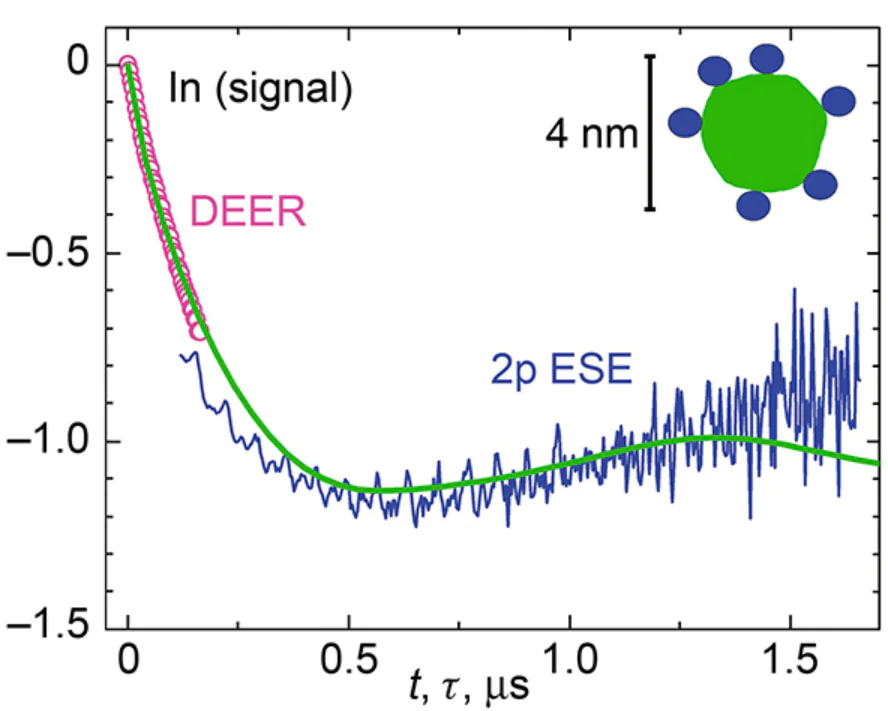
The spin-labeled cholesterol analogue 3β-doxyl-5α-cholestane (DChl) was studied in lipid membranes using the PDS methods.[100][101] Note that although its structure lacks the hydroxyl group that is important for cholesterol functionality, it does contain a flat sterol core and an alkyl tail.

CW EPR data for DChl in lipid membranes composed of either the saturated lipid 1,2-dipalmitoyl-sn-glycero-3-phosphocholine (DPPC) or the unsaturated lipid 1,2-dioleoyl-sn-glycero-3-phosphocholine (DOPC) were explained within the framework of a model of encapsulation of DChl molecules in lipids.[100] It was found that due to encapsulation, the minimum approach of DChl molecules to each other lies in the range from 2.5 nm to 5 nm (for a molar fraction of DChl, from 0.04 to 0.005, correspondingly). The local concentration in these models was several times higher than the average one, which indicates clustering of DChl molecules.
Ternary mixtures of DPPC, DOPC and cholesterol are often used as model lipid membranes for studying lipid rafts.[92][102][103] Such mixtures have also been used to study rafts using DEER.[101] The obtained results directly indicate clustering of DChl molecules, because the obtained local concentrations of these molecules were 4 – 6 times higher than the average concentrations. It was found that their lateral distribution in clusters in the absence of cholesterol is random, but in its presence it becomes quasi-regular, with a two-dimensional square or hexagonal superlattice (see Fig. 7). For a cholesterol content of 20 mol.%, at which lipid rafts are formed at physiological temperatures,[92][102][103] the superlattice parameter a found was 3.7 nm. This result is interpreted as evidence of the presence of additional nanoscale substructure (subdomains) in rafts, with DChl molecules being embedded between the subdomains. The obtained data on such subdomains are discussed[104][105] in connection with molecular dynamics (MD) calculations of these systems.
We would like to point out that the comparison of DEER experimental data with their simulation[101] was carried out for a model that does not assume any cluster boundaries in lateral directions for the membrane (i.e., for the infinite cluster model). Of course, clusters must have such boundaries, otherwise, the local concentration would not have exceeded the average concentration by several times. This apparent discrepancy is explained[101] by the fact that for cluster sizes larger than ~ 10a, the DEER method becomes insensitive.
3.3.3. Free fatty acids
Free fatty acids are always present in mammalian cell membranes, the amount of which varies in the range of 0.3 – 10 mol.% of the total amount of lipids. Free fatty acids are continuously synthesized and consumed, being important components of membranes: they increase their fluidity, serve as a source of their structural components, and are involved in a number of biological processes, from cellular signalling to cell fusion. In some pathological conditions, their significant increase is observed, which can serve as a protective mechanism for cells.
DEER has been applied to study intermolecular d-d interactions between doxyl-spin-labeled stearic acids (DSAs) in phospholipid bilayers composed of either an equimolecular mixture of DPPC and DOPC,[106] or 1-palmitoyl-2-oleoyl-sn-glycero-3-phosphocholine (POPC).[107] In the first case, the alkyl chains of the lipids represent relatively more ordered structures than in the second. The obtained data on the time dependence of the signal for the DOPC/DPPC mixture were in good agreement with the two-dimensional model of random distribution of molecules (see equation (16)), and for POPC, they fitted well with the three-dimensional model (see equation (15)). This difference in the models is explained by the greater disorder of the membrane made of unsaturated lipids of the POPC. The relative volume local concentrations of DSA molecules in the POPC membrane, Clocal /Clipids (Clipids is the concentration of lipids, can be taken as 0.8 nm–3), measured by comparing the experimental time dependences of the DEER signal with the theoretical calculation based on equation (15), are shown in Fig. 14 as functions of their average molar concentrations χ in the membrane.
![[{"id":"KLaCReZGha","type":"paragraph","data":{"text":" Local volume concentrations in the POPC membrane for 16-DSA (spin-labeled at the 16-position of the alkyl tail carbon at oms) (circles) and 5-DSA (spin-labeled at the 5-position of the alkyl tail carbon atoms) (squares) in dimensionless C<sub>local</sub>/C<sub>lipids</sub> mole/mole units (see text) as functions of their average molar content χ. Dashed and dotted lines correspond to the functions Clocal /Clipids = χ and C<sub>local</sub>/C<sub>lipids</sub> = 2χ, respectively.<sup>107</sup>"}}]](/storage/images/resized/fnuSwTg1k1TfhqzUgm3Zm17tOP48h5XQhc4PGLJy_xl.webp)
Fig. 14 shows that at χ < 2 mol.%, Clocal /Clipids is twice as high as χ. The excess of the local concentration over the average means that DSA molecules are assembled into lateral clusters, and the twofold excess can be explained within the framework of the model of alternating clustering in two opposite monolayers of the bilayer, as shown schematically in Fig. 15. This clustering model can be called the ‘chess box’ model, by analogy with how the black and white squares in a closed chess box are opposite each other.
![[{"id":"TWISNMrLLE","type":"paragraph","data":{"text":"Schematic representation of the ‘chess box’ clustering for DSA molecules spin-labeled at either the 5- (red circles) or 16- (green squares) positions of the alkyl tail carbon atoms (shown with blue arrows). For compactness, the labels are depicted as belonging to the same molecule. The diamonds at the ends of the arrows correspond to carboxyl groups. The gray circles indicate that this DSA clustering pattern is reproduced in neighboring cells."}}]](/storage/images/resized/pcXhoDI3XwwxldhDsV5aKsZr1IH8rncYQDgi6X88_xl.webp)
It also follows from Fig. 15 that even at χ = 2 mol.%, the value of Clocal is at least 20 times smaller than Clipids. This means that the distance between DSA molecules in clusters is significantly greater than the distance between lipids. That is, clustering does not occur through direct association (sticking together) of DSA molecules, but is carried out indirectly involving the lipid environment. The absence of direct sticking of DSA molecules also follows from the absence of excessive broadening in the CW EPR spectra.[107]
At χ = 2 mol.%, the data in Fig. 14 indicate that the local concentration of 5-DSA molecules (the label is located relatively close to the membrane surface) is less than that of 16-DSA molecules (the label is located in the centre of the membrane). This difference is explained[106] by the fact that as the concentration increases, the polar carboxyl groups begin to repel each other. The local concentration of labels in the 5-th position will decrease due to the repulsion, while in the 16-th position, conversely, the local concentration of labels will increase due to their approach. This is also shown schematically in Fig. 15. Note that this effect has a threshold character: it occurs at χ = 2 mol.%.
We also note that, as in the previous case of spin-labeled cholestane, the analysis of experimental data here was carried out for a model that does not assume any cluster boundaries in the lateral directions (i.e., for the infinite cluster model). And again, this simplification is not a limitation of the model, since the dependence on size quickly disappears as it increases.
The aggregation of a 14-mer AMP chalciporin A and its effect on DSA clustering was studied.[107] The results showed that this peptide influences the formation of alternative DSA clusters, namely, at χ = 2 mol.%, local concentrations for 5-DSA and 16-DSA molecules are equalized. This fact was explained by the clustering of DSA molecules around the peptide (Fig. 16). Indeed, this type of clustering can neutralize the above-described effect of clustering of DSA molecules ‘relative to each other’ with repulsion of their polar heads.
![[{"id":"Ua99MT3daT","type":"paragraph","data":{"text":"Schematic representation of the effect of the AMP chalciporin A (shown as thick blue sticks) on the clustering of spin-labeled stearic acid molecules (thin black curved sticks) in the lipid membrane."}}]](/storage/images/resized/Q76Btql5LWtGhWzrVsIoDv6DqtV9cSogkIRyEy6w_xl.webp)
It was suggested that clustering of this type may represent another mechanism of action of AMPs.[107] Indeed, the capture of free fatty acids by peptides can ‘switch off’ participation of the latter in important cellular processes and, as a result, lead to the death of bacterial cells. An intriguing finding here is that DSA clustering around the peptide appears even at very low concentrations: as low as at a P/L ratio of 1/10000. This ‘low-dose’ effect certainly deserves further study.
It should be noted that the effect on DSA clustering in lipid membranes, although not at such low concentrations, was also found for other types of AMP such as alamethicin,[87] trichogin[88] and tylopeptin.[89]
3.3.4. Nonsteroidal anti-inflammatory drugs
Nonsteroidal anti-inflammatory drugs (NSAIDs) such as aspirin, ibuprofen, diclofenac and others, are over-the-counter medications that are widely used in medical practice due to their antipyretic and analgesic effects. NSAIDs are also used to treat other conditions, including cancer, arthritis and neurodegenerative diseases. Most NSAIDs are non-selective inhibitors of the cyclooxygenase enzyme, which is responsible, in particular, for the production of prostaglandins, which regulate inflammatory processes in the body. NSAIDs are also known to have side effects, many of which are related to their membrane activity. To understand the therapeutic effects of NSAIDs and develop ways to reduce their side effects, it is important to understand the molecular mechanisms of NSAID interactions with the plasma membrane.
To apply EPR methods to the study of the NSAIDs such as ibuprofen and diclofenac, their spin-labeled analogues, ibuprofen-SL[108] and diclofenac-SL,[109] were synthesized. It should be noted that, although their structures show that the spin label significantly increases the volume of the original drug molecules, it does not change the amphiphilic nature of these molecules. In particular, the spin label does not affect the carboxyl groups.
It has been shown,[108][109] that these spin-labeled analogues integrate into lipid membranes. Studies using enhanced paramagnetic relaxation nmR have provided a detailed picture of the membrane depth distribution of ibuprofen-SL[110] and diclofenac-SL molecules.[111]
DEER was applied to study ibuprofen-SL in POPC membrane.[60] It turned out that the resulting time dependences of the DEER signal are consistent with the model of a two-dimensional random distribution of spins (see equation (16)). From these data, the values of the surface local concentration of ibuprofen-SL, σlocal , were found. When comparing the σlocal/σlipid ratio, where σlipid is the surface concentration of lipids in the membrane (that is close to 1.7 nm–2), with the average concentration χ in the membrane, it turned out that at χ < 1 mol.%, the σlocal/σlipid is twice as large as χ (similar to the data in Fig. 14). This fact can again be explained within the framework of alternative clustering in two membrane monolayers, i.e. the ‘chess box’ model (see Fig. 15). At χ > 1.5 mol.%, the values of σlocal/σlipid and χ are equalized, that is, the alternative clustering disappears, and the ibuprofen-SL molecules are distributed evenly between the two monolayers.
Similar results on the dependence of the local concentration on the average one in membranes were also obtained for diclofenac-SL.[112] In this regard, it should be noted that the similarity found for the spatial distribution of ibuprofen-SL and diclofenac-SL in membranes means that even significant differences in their structures are not of fundamental importance for the discovered features of their clustering. Then, of course, the differences between unlabeled and labeled molecules should not make any difference, since they are significantly smaller than the differences between the parent ibuprofen and diclofenac molecules. It can be assumed that these characteristics are a general property of any small amphiphilic molecules in the cell membrane.
It should also be noted that molecular dynamics calculations also indicate that the attachment of a spin label to the ibuprofen molecule has only a minor effect on spatial distribution of these molecules in the membrane.[113]
3.3.5. Small molecules and lipid rafts, features of DEER of nanoclusters
Of particular interest is the question of the influence of lipid rafts on the mutual spatial distribution of small guest molecules, such as ibuprofen or diclofenac. For ibuprofen-SL, this issue was investigated for lipid membranes of DOPC/DPPC (1 : 1) composition with the addition of cholesterol in different proportions.[45][114] Local concentrations of ibuprofen-SL were determined from the time dependences of the DEER signals. In the absence of cholesterol (i.e., in the absence of rafts), the local concentrations found were approximately 2 times higher than the average concentration (which again corresponds to the ‘chess box’ model). At cholesterol concentrations of 20 mol.% and 30 mol.%, for which the appearance of rafts is postulated,[92][102][103] these concentrations increased sharply. This increase undoubtedly indicates, firstly, a change in the nature of clustering of ibuprofen-SL molecules, and secondly, the influence of rafts on this process. Similar results were obtained when using diclofenac-SL[112] instead of ibuprofen-SL.
Here, it is worth noting a fundamental difference between the observed clustering in the presence of rafts and the clustering discussed above in their absence. In the absence of rafts, a model of ‘infinite’ clusters (alternating, however, in two opposite layers of the bilayer, like a ‘chess box’) could be used. For such clustering, clusters have nanometer sizes only in the direction perpendicular to the membrane, while in lateral directions, the size of clusters is difficult to determine using DEER methods. The sharp increase in local concentrations in the presence of rafts can only be explained by the appearance of clusters limited in lateral directions, that is, nanoclusters in all three dimensions.
In these studies,[45][112][114] for high concentrations of ibuprofen-SL and diclofenac-SL, an effect of the dependence of the decay of the DEER signal with time t on the interval τ of the three-pulse DEER sequence was found (Fig. 17). And the data of Fig. 17 show that this effect occurs only in the presence of cholesterol in the system (i.e., in the presence of rafts).
![[{"id":"cVwepkwk8z","type":"paragraph","data":{"text":"Semilog plot of three-pulse DEER data for ibuprofen-SL in a DOPC/DPPC/cholesterol bilayer at different delay times τ: 200, 300, and 800 ns. Cholesterol content x<sub>chol</sub> and ibuprofen-SL concentration χ are indicated. For clarity of presentation, the data are shifted vertically.<sup>45</sup>"}}]](/storage/images/resized/sfrFgSRhaR52qSObvDbKFdkiMLmOg4IV48e3PYGp_xl.webp)
As mentioned above, similar effects in the four-pulse DEER dependence on τ’ for multi-spin oligomers has also been reported for tetradecamers,[71] hexa- and heptamers,[77] pentamers and hexamers,[64] in some cases also for dimers.[78]
This effect, as briefly discussed above, can be explained by taking into account the d-d interaction between the A spins.[65][66] Indeed, for multi-spin nanoclusters, the role of the d-d interaction between spins A can increase sharply, which will lead to a decrease in the DEER signal for closely located (and/or closely oriented) spins A in the nanocluster. Then, the contribution of such spins to the overall DEER signal will decrease with increasing τ (τ' in four-pulse DEER). Thus, for nanoclusters with a large number of spins, an additional, ‘parasitic’ channel for the manifestation of the d-d interaction of spins A with each other appears.
Here, it can be noted that, on the other hand, the very fact of the dependence of the DEER signal on the interval τ (τ') may indicate the presence of multi-spin nanoclusters in the system. From the data in Fig. 17 it then follows that nanoclusters arise in the presence of rafts and at an ibuprofen-SL concentration χ = 2.5 mol.%.
For such clusters, one should make measurements at different time delays τ (τ') and use only the data obtained at sufficiently small values so that this ‘parasitic’ effect becomes smaller. This is precisely what was done in studies[45][112][114] in which the value of τ was reduced to 200 ns. But in this approach, a serious problem arises of losing the possibility of studying large distances between spins, since always t < τ (t' < τ'), and a larger distance in DEER corresponds to a longer time t.
However, there is a simple way to solve this problem, which is to combine the DEER and 2p ESE methods.[45] The possibility of such a combination is determined by the identical physical basis of both methods — see Subsection 2.4. Since 2p ESE is a single-frequency method, it only studies the interaction of spins A (which are also spins B), so the additional ‘parasitic’ interaction channel here simply becomes the ‘working’ one. And the drawbacks inherent in this simple method (‘dead time’ problem, thermal relaxation effect, ESEEM interference) are largely eliminated, as mentioned above in Subsection 2.4, by measuring the time dependences of the signal obtained for two different excitation efficiencies and then dividing them by each other. These two different excitation efficiencies were achieved[45] by performing measurements at two field positions in the EPR spectrum. The ratio of the two signals at time zero was obtained by simply dividing the intensities of the CW EPR spectrum (in the integral form) at these two positions, the 2p ESE data were then divided by this ratio.
Fig. 18 shows the data obtained by the combined application of DEER and 2p ESE methods for ibuprofen-SL in DOPC/DPPC and DOPC/DPPC/cholesterol membranes.[45] In the first case, lipid rafts should not be present, while the second case suggests their presence. From this figure it is clear that, firstly, the data from the two methods are well ‘stitched’ together (no artificial adjustment of the parameters is used for this ‘stitching’). Secondly, the time dependences for the cases with and without rafts are completely different. In the first case, the signal dependence on the time between pulses has a monotonic decaying pattern (close to the theoretical one for a uniform two-dimensional distribution of spin labels (see equation (16)). In the second case, the dependence is non-monotonic, with a clear minimum. The experimental data thus obtained were compared with theoretical calculations for the model of a nanocluster in the form of six spin labels randomly located around a circle as described in Section 2.5.2 (see Fig. 6a). Fig. 18 shows very good agreement between experiment and theory (some disagreements at large t may be induced by the extreme simplicity of the model).
![[{"id":"qm4dRuUR4q","type":"paragraph","data":{"text":"Semilog plot of combined DEER and 2p ESE data for ibuprofen-SL (with χ = 0.5 and 2.5 mol.%) in DOPC/DPPC and DOPC/DPPC/cholesterol bilayers. Data for the second case are shifted down by 2 divisions. Circles represent DEER data for τ = 200 ns, solid lines represent 2p ESE data. The dashed line shows the calculation results for a model of six spin labels randomly distributed around a circle of radius 1.9 ± 0.05 nm.<sup>45</sup>"}}]](/storage/images/resized/iDLkWYhmRGtKk6zv5CMDnoE2E1v3cYYosK9LOfg3_xl.webp)
The result obtained for cholesterol-containing membranes was interpreted[45] as a consequence of the interaction of ibuprofen-SL molecules with lipid rafts. Necessary for such an interpretation is the additional assumption that lipid rafts have a certain two-dimensional substructure consisting of subdomains of about 4 nm in size, on the surface of which adsorption[46] of guest molecules occurs. It should be noted that a similar assumption was made in the analysis of DEER data on spin-labeled cholestane.[101] A schematic representation of the clustering model of ibuprofen-SL molecules is shown in Fig. 19.
![[{"id":"633W8VlSI6","type":"paragraph","data":{"text":"Top view of a portion of the membrane: schematic representation of possible subdomains (dark yellow) in a lipid raft with a cluster of 6 ibuprofen-SL molecules (red circles) located between the subdomains. R<sub>min</sub> denotes the minimum distance between molecules.<sup>45</sup>"}}]](/storage/images/resized/EkyMCUqCRnU7WlGNjn2UEnjcDYGhLu8jzFXQKBfm_xl.webp)
The presence of nanoscale subdomains in lipid rafts has been suggested for the interpretation of data from a variety of methods.[115-121] In all of these studies, the size of the subdomains was, however, estimated very roughly as a few nanometers. As can be seen from the data in Fig. 18, the DEER method in combination with 2p ESE gives quite definite estimates of the sizes of such subdomains.
3.4. Nanoclusters in polymers
Although the possibility of using PDS methods to study polymer nanostructure has been known for a long time,[122] examples of using PDS to investigate the possible formation of nanoclusters of guest spin probe molecules in these systems are few. Using PDS, the stable free radicals of galvinoxyl (Gx), used as a dopant in the active layers of organic solar cells, were studied.[123] It is known[124][125] that at a Gx concentration of 2 wt.% in a photovoltaic composite consisting of a mixture of the polymer PCDTBT (a copolymer from the poly(2,7-carbazole) family) and modified fullerene C60 (PCBM), an increase in photocurrent occurs.
Due to the rather narrow EPR spectrum for Gx (approximately 1 mT), the DEER method is inapplicable here. Therefore, the 2p ESE method was used. The microwave amplitude in these experiments was ~ 0.6 mT, i.e., comparable to the width of the EPR spectrum, so that the pulses excited the spectrum more or less completely. As discussed above in Subsections 2.4 and 3.3.5, the application of 2p ESE method is based on measuring the time dependences of the ESE signal for two different excitation efficiencies, followed by obtaining the ratio of the two dependences. Different excitation efficiencies in this work were achieved by varying the duration of the second microwave pulse in the two-pulse sequence. The value of the result of dividing the two time dependences at τ = 0, as well as the difference in the efficiencies of the two types of excitation, were determined in a separate experiment for the model system Gx in glassy toluene. The obtained experimental 2p ESE data for 2 wt.% Gx in the photovoltaic composite are shown in Fig. 20.
![[{"id":"4NnJVO8dlr","type":"paragraph","data":{"text":"Time dependence of the 2p ESE experiment at 2 wt.% Gx in a photovoltaic composite of PCDTBT polymer and modified fullerene PCBM. The yellow circle represents the starting point obtained in a separate experiment. The smooth curve shows the simulation results for the proposed structure of 8 Gx molecules surrounding an octahedral complex of 6 fullerene molecules (shown in the insert).<sup>123</sup>"}}]](/storage/images/resized/puzVybJBkWO9aUY3ypO8kZ8npQfYDl11433D0rLi_xl.webp)
The number of Gx molecules in the cluster was determined from the signal decay depth using formula (14); it was found to be 8. The experimental 2p dependence of the ESE agrees well with calculations for a model in which 8 Gx molecules are located on the surface of a sphere with a radius of 2.0 nm. Such a structure can arise if the Gx molecules are located on the 8 faces of an octahedron consisting of 6 PCBM molecules (see insert in Fig. 20).
From the obtained results[123] it follows that clusters appear at a Gx concentration of 2 wt.%, which correlates with the above-mentioned literature data on the enhancement of photocurrent at this concentration. It can be assumed that the molecular mechanism of this enhancement is associated precisely with the formation of these nanoclusters.
The information obtained in this work also indicates that these clusters repel each other, forming a quasi-regular nanostructure in the matrix.
4. Conclusion
The analysis of the DEER frequency spectra for model multi-spin systems carried out in this review showed that in the case of spin-labeled nanosized oligomers and clusters of molecules with the number of spins N > 2, the reliably extracted parameters are the number N itself, the total size of the system and the minimum (or characteristic) distance between spins. In case of suitable geometry and small N, it is also possible to determine the distances between individual spin labels.
Model calculations also allowed us to conclude that the effects of multi-spin excitation at N > 2 in the DEER frequency spectrum lead mainly to the broadening of spectral lines. And these effects have only a minor influence on the values of the aforementioned main extractable parameters, and have almost no effect on the N value.
An important circumstance that must be taken into account when applying DEER to multi-spin systems, which was experimentally discovered by different authors for different systems, is the dependence of the DEER signal on the internal parameter of the method, viz., the delay time between echo-forming pulses (time τ in a three-pulse DEER, time τ' in a four-pulse DEER). This dependence is explained by the mutual d-d interaction between the spins observed in the DEER (spins A), which leads to a decrease in the DEER signal for those spin labels in the system that are relatively close to each other and/or have close orientations. These spin labels then begin to make a smaller contribution to the overall DEER signal, which becomes smaller the longer the times τ and τ'. The probability of close distances and/or orientations for different spins increases specifically for multi-spin clusters, simply due to the greater number of possible combinations. This effect of d-d interaction between A spins in DEER can also occur for molecules with two spin labels when the system under study contains different conformers with significantly different extension sizes; proximity of spatial orientations of the labels enhances this effect.
This effect of the dependence of the DEER signal on the method internal parameter significantly complicates the analysis of d-d interactions: the general picture of the formation of the DEER signal considered in Section 2.2 becomes simply inapplicable. The influence of this effect can be reduced in two ways. One is to diminish the efficiency of excitation of spins A.[64] However, this reduces the signal intensity and, consequently, the sensitivity of the method. Another approach involves diminishing the times τ and τ'. In order to avoid the loss of available information on the d-d interaction due to the corresponding reduction of the measurement interval t or t' (always t < τ, t' < τ'), one can use the supplementation of the DEER data with 2p ESE data.[45] In the latter case, spins A are simultaneously spins B, and the effect that complicates the consideration of the DEER data becomes in 2p ESE simply a source of useful information.
In this regard, it should be noted that the potential of the 2-pulse ESE method is currently underestimated. It is believed that in the future, this method will find wider application for studying nanoscale oligomers and molecular clusters in various systems.
The potential of PDS methods in studying nanoscale oligomers and molecular nanoclusters can be extended to a wide range of applications. These methods can be used anywhere where structural heterogeneity in the nanometer range is expected. In addition to the systems described in this review, these could include ionic liquids,[126-128] deep eutectic solvents,[129-132] internally disordered proteins.[133-136] For all these systems, spin-label EPR spin labels have already been successfully applied to study various aspects of their structure and dynamics.[126-129] [133]
Acknowledgements
The review was prepared with the financial support of the Russian Science Foundation (Project No. 25-23-00061). The author expresses gratitude to Anna S. Kashnik and Olga V. Polukarikova for technical assistance in preparing the manuscript.
5. List of abbreviations
Aib — α-aminoisobutyric acid,
Alm — alamethicin,
АMP — antimicrobial peptides,
CW EPR — continuous wave EPR,
DChl — 3β-doxyl-5α-cholestane,
d-d — magnetic dipole-dipole,
DEER — double electron-electron resonance,
DOPC — 1,2-dioleoyl-sn-glycero-3-phosphocholine,
DPPC — 1,2-dipalmitoyl-sn-glycero-3-phosphocholine,
DQC — double quantum coherence method,
DSA — doxyl-spin-labeled stearic acid,
ESE — electron spin echo,
2p ESE — two-pulse electron spin echo method,
ePC — egg L-α-phosphatidylcholine,
ESEEM — electron spin echo envelope modulation,
FRET — Förster resonance energy transfer,
Mag2 — GIGKFLH SAKKFGKAFVGEIMNS-amide,
MD — molecular dynamics,
MTSSL — (1-oxyl-2,2,5,5-tetramethyl-3-pyrrolin-3-yl)methylmethanethiosulfonate,
NSAID — nonsteroidal anti-inflammatory drugs,
PDS (EPR) — pulsed (EPR) dipolar spectroscopy,
PELDOR — pulsed double electron-electron resonance,
PGLa — GMASKA GAIAGKIAKVALKAL-amide,
P/L — peptide-to-lipid ratio,
POPC — 1-palmitoyl-2-oleoyl-sn-glycero-3-phosphocholine,
RIDME — relaxation induced dipolar modulation enhancement,
SIFTER — single frequency technique for refocusing,
TOAC — 2,2,6,6-tetramethyl-N-oxyl-4-amino-4-carboxylic acid.
References