Keywords
Abstract
Surface-enhanced Raman spectroscopy (SERS) is a powerful analytical technique for substance identification and analyte determination in ultralow concentrations in complex media. Recent progress in SERS-based biosensors has paved the way to reproducible, sensitive, rapid and easy-to-use point-of-care (PoC) systems that are promising for the implementation in diagnostics. This review summarizes different approaches in biosensor construction, analytical signal generation, as well as the first attempts of their use for the real clinical samples. The review focuses on the pathogen detection in the biological liquids in trace amounts. Available clinical diagnostics failed to meet criteria for accurate PoC diagnostics, such as time of analysis < 20 min, limits of detection of 100 – 1000 genomes mL1-1 and specificity of detection. Several SERS-biosensors met these criteria achieving multiple pathogens in the sample. Another significant ability of the SERS-based biosensors and test systems is rapid determination of drug-resistance at low pathogen titers. Several excellent examples and future prospects are discussed in the review. This critical analysis demonstrates that the successful integration of SERS into diagnostic platforms depends on the combination of three main elements: 1) a reproducible SERS substrate with a high enhancement coefficient, 2) a recognition element that ensures specificity of detection, and 3) additional approaches for concentrating the analyte and amplifying the analytical signal.
The bibliography includes 300 references.
1. Introduction
Biosensors are defined as analytical devices incorporating a biological material, a biologically-derived material or a biomimic intimately associated with or integrated within a physicochemical transducer or transducing microsystem, which may be optical, electrochemical, thermometric, piezoelectric, magnetic or micromechanical. Biosensors allows an ultimate specific and accurate determination of the analytes in complex media like human-derived clinical samples or food. The analytical performance of the biosensors depends in a large extent on the chosen analytical method. Surface-enhanced Raman spectroscopy (SERS) is a powerful analytical technique for substance identification and analyte determination in ultralow concentrations. Recent progress in SERS-based biosensors has paved the way to reproducible, sensitive, rapid and easy-to-use point-of-care (PoC) systems that are promising for the implementation in diagnostics.
The development of PoC testing systems is particularly relevant for pathogen detection. The state of the art in this field is reviewed using respiratory viruses as examples; these viruses cause acute infection with a short latent period and include such variants as influenza A virus (IAV) and severe acute respiratory syndrome coronavirus 2 (SARS-CoV-2). IAV causes around one billion cases of seasonal influenza each year, including 3 – 5 million severe cases. It results in 290 000 – 650 000 deaths from respiratory complications annually. SARS-CoV-2 has become an epidemic virus. Both viruses are dangerous for elderly people, immunocompromised patients, pregnant women, and children.[1][2] The recent SARS-CoV-2 pandemic has revealed that the existing laboratory methods for diagnosing respiratory viruses, polymerase chain reaction (PCR) with reverse transcription and lateral flow immunoassay (LFIA), are not convenient for rapid illness screening in crowded places. PCR has acceptable limit of detection (LoD) but require extensive sample manipulation, skilled operators and time of analysis out of PoC range (< 20 min). LFIA is easy to use and provides results in 10 – 15 minutes, but it has high LoD resulting in omittance of 40 – 60% infected patients.[3-5]
Another emerging problem is the rapid detection of antibiotic-resistant bacteria strains. Antibiotic-resistant infections cause about 5 million deaths each year.[6] According to analytical reports, resistant infections could become the leading cause of death by 2050, causing more than 10 million deaths annually.[7] The main reason for this is the intensive use of antibiotics in medicine, agricultural industry, and other fields.[8] Improper use of antibacterial therapy, such as incomplete treatment or inadequate dosage, greatly increases the risk of resistance.[9] The current protocols for antibiotic susceptibility testing are either time-consuming or covers only a part of resistance mechanisms. This field is open for creation of new biosensors or test systems for PoC antibiotic selection.
This review analyzes the actual problems in SERS-based biosensor construction. A critical analysis of the key elements of biosensors, namely, SERS substrates, recognition elements, and additional approaches for concentrating analytes and amplifying the analytical signal, is presented. The review focuses on the pathogen detection in the biological liquids in trace amounts aiming detection of 100 – 1000 genomes mL–1 for 20 min in the clinical sample that meets PoC criteria. The first attempts to use sensors for real clinical samples were analyzed. Several SERS-based test systems are discussed on a par with biosensors in order to compare them. Also, SERS-based biosensors and test systems for rapid determination of drug-resistance at low pathogen titers are discussed.
2. Surface-enhanced Raman spectroscopy as an ultrasensitive analytical method
Raman spectroscopy is a highly specific method for the qualitative and quantitative determination of compounds based on inelastic (Raman) light scattering. The non-invasiveness of the analysis has a great advantage for searching for counterfeit medicines without damaging the original packaging,[10] and the speed of analysis, reaching up to several seconds per sample, and the high sensitivity of impurity detection make it possible to effectively use the method in criminology, for example, to track the sources of distribution of narcotic substances by differences in their composition.[11] The radiation intensity of Raman scattered light is 103 – 105 times lower than Rayleigh’s, which leads to low sensitivity of the Raman spectra and complicates identification of substances with low content in the mixtures.
The interaction of light and matter is very weak due to the significant difference between the electronic (Δre ~ 1 nm) and photonic localization (for visible radiation l ~ 500 nm). The absorption and emission efficiency of an electromagnetic wave is proportional to the square of the ratio of these values.[12] It is possible to change the nature of the interaction between incident radiation and matter using methods for transforming electromagnetic waves into localized modes, such as the near field, which occurs near the active element of a plasmonic antenna or a nanostructured metal surface.
2.1. Basic principles of Raman scattering enhancement
The wavenumber and momentum of a surface plasmon polariton is greater than the wavenumber of a photon in free space. The excitation of the surface plasmon by ordinary photons is impossible. Therefore, special methods of excitation of surface plasmon polaritons are used, including prismatic, lattice insertion or the use of rough structures. In the case of prismatic input through a more optically dense medium (for example, through a glass prism) at the metal-glass interface occurs, the projection of the photon wave vector onto the x axis is determined with the equation (1):
where k0 is the wave vector of the wave propagating in the air, εd2 is the dielectric constant of the glass prism, θ is the angle of incidence. As a result, phase synchronism can be performed at the interface between a metal and an optically less dense medium, e.g. air (Fig. 1). The dispersion curve of a plasmon at the metal — air interface intersects the dispersion line of a photon propagating in glass.
![[{"id":"uFZByv1_9K","type":"paragraph","data":{"text":"Kretschmann scheme for surface plasmon excitation"}}]](/storage/images/resized/oNddORlWW8NE3Mt5gk8Y4Ul2DksR6E0MrimNw9E8_xl.webp)
The phase synchronism condition can be executed with a lattice input using photon diffraction on a periodic structure. Both metal and dielectric can be periodically perforated. Such a structure can have periodic structuring in one or two dimensions. In this case, the phase synchronism condition looks like equation (2):
where ed is the dielectric constant of the medium from which light falls, Gx = ex2π/dx and Gy = ey2π/dy are the reverse lattice vectors parallel to the metal–dielectric interface, dx and dy are the lattice periods along the x and y axes, ex and ey are the basis vectors of the x and y axes, kspp is a surface plasmon polariton wave vector.
Surface plasmon resonance can also be excited on surfaces with random roughness or with localized diffusers that diffract incident light; the condition of phase synchronism can be possible.
2.2. SERS substrates
SERS commonly used colloid nanoparticles or complex substrates that are composed of metal — dielectric structures, e.g., metal nanoparticles on the dielectric surface. In the case of a single metal particle, a localized plasmon occurs, while the electric field strength decreases in a power-law manner with distance from it. In the case of an interacting ensemble of plasmonic nanoparticles, a wave propagating along the interface between metal and dielectric occurs — a surface plasmon polariton, the local field of which decays relatively slowly (on distances of the order of 30 – 100 nm away from the surface).[13] In addition, the resonance conditions during the excitation of localized plasmons and surface plasmon polaritons that occur at the interfaces of metal and dielectric surfaces depend on the geometry of the SERS substrates, the dielectric permittivity of the metal and the environment. The enhancement occurs on such surfaces quite heterogeneously, at certain local points reaching 1010 – 1012 times,[14] that allows tracking of single molecules using for example, tip-enhanced Raman spectroscopy. For biosensors, it is necessary to provide microscopically uniform surface enhancement of the Raman scattering intensity, which can only be achieved through the use of nanoperiodic SERS substrates. Recent attempts in design of lithographic periodic substrates resulted in renewable SERS substrates with enhancement factors up to 1011 times that enables single molecule detection. An additional advantage of this type of substrates is their high efficiency in conjunction with laser radiation with a wavelength of 1064 nm, which does not excite photoluminescence of practically any molecules. The amplification effect is based not on the excitation of random localized plasmons, but on the resonant excitation of collective surface plasmon-polariton modes.[15][16]
Two mechanisms form the basis of SERS phenomenon. The electromagnetic amplification mechanism is determined by the configuration of the nanostructure and the conditions of optical excitation. Therefore, it does not depend on the type of test molecules or other objects. For adsorbed molecules in direct contact with the metal surface, there may be an additional ‘chemical mechanism’ of SERS amplification resulting from the coupling of the electronic orbitals of the molecule and the states of the conduction band of the metal surface (Fig. 2). The effect of the chemical amplification mechanism is multiplicatively combined with the electromagnetic amplification mechanism, but depends on the type of molecule and its chemical affinity with the metal surface.[17] This effect can be most pronounced on colloidal systems, for which the amplification of the Raman scattering signal is determined by the aggregation process.
![[{"id":"YS8BSCYBfK","type":"paragraph","data":{"text":"A scheme of the increase of Raman spectrum intensity by nanostructured surfaces (<i>a</i>). The electromagnetic (<i>b</i>) and chemical (<i>c</i>) mechanisms are responsible for SERS intensity. LUMO is the lowest unoccupied molecular orbital, HOMO is the highest occupied molecular orbital, CB is a conduction band, VB is a valence band."}}]](/storage/images/resized/RMj9yYgfjZzDGqWc7NOSRo2znQ4KI87GNHyx706L_xl.webp)
Thus, either solid-state nanostructured substrates or colloidal solutions of nanoparticles are used as SERS-active substrates. The substrates can be made using one of the following methods:
— deposition of metal nanoparticles on a dielectric surface;[18]
— magnetron or thermal spraying of thin metal films onto the surface of a dielectric substrate;[19][20]
— using lithographic methods, plasma chemical etching and spraying on the rough surfaces that form a variety of geometries of the SERS substrates.[16][21][22]
When developing biosensor systems, the effect of resonant Raman scattering (SERRS, surface-enhanced resonance Raman scattering) is often used, which occurs when two resonances are observed simultaneously — the SERS effect (the laser frequency is close to the peak of plasmon absorption of the SERS substrate) and the resonant absorption effect (the frequencies of laser radiation and the absorption peak of the substance coincide).[23] The resonance effect can provide the detection of extremely low, even attomolar, concentrations of the analyte.[24]
3. Classification of SERS biosensors and test systems
SERS-based biosensors can be classified based on 1) the assay principles, 2) the recognition elements or 3) the additional amplification strategies besides SERS substrates. The key assay principles for analyte detection are direct binding, sandwich-like, and competitive assays (Fig. 3).[25]
![[{"id":"5jPWwrlcai","type":"paragraph","data":{"text":"A scheme of biosensors with direct, sandwich-like and competitive principles of generation of the analytical signal on the example of DNA aptamers as recognition molecules.<sup>25</sup>"}}]](/storage/images/resized/7uBCaWLMwGbCVxR7f4myOGRZPUdMzPnMeuONnAmS_xl.webp)
The recognition elements are non-obligatory for SERS detection, as the intrinsic spectra of the target can be registered (this approach is referred to as test systems). However, specific detection of target molecules in complex media is much easier and accurate when the recognition elements are introduced allowing a clear discrimination between biomolecules of the similar nature, e.g., different proteins, in complex biological media. For this purpose, in the biosensors, SERS-active surfaces are modified with recognition elements, such as antibodies, aptamers, oligonucleotide probes, etc. The recognition elements concentrate the target molecules on the SERS surface increasing the intensity of their spectra.
To decrease the limit of detection, additional amplification strategies are used, e.g., SERS or SERRS tags, catalytic hairpin and enzyme-based signal amplification. SERS tags with an intense SERS signal can be used to stain the analyte. SERS tag contains SERS active molecules whose spectrum is much more intense compared to spectra of such targets as nucleic acids or proteins. SERS tag spectrum can be confidentially identified in the presence of other molecules at much lower concentrations. Detection of SERS tags can be provided by the sandwich-like method similar to LFIA, where the analyte binds the recognition element immobilized on the surface, and also binds the recognition element carrying a SERS tag (see Fig. 3). The unbound molecules are washed out, so the signal is produced by the ternary complex only, namely surface-analyte-SERS tag.[26][27]
Alternatively, the SERS tag can be remoted from the surface during the analуte binding. For example, DNA aptamer is immobilized on the surface and forms a complex with a complementary DNA strand labeled with a SERS tag. When the analyte is added, the complex with the complementary strand is broken due to a competition for the aptamer between the analyte and the complimentary strand. As a result, the SERS tag dissociates from the surface decreasing the signal (see Fig. 3).
Direct determination, i.e. one-step binding of the target, is interesting as it is much simpler compared to other approaches. However, the binding process should provide some analytical signal. The majority of the biological targets have no intense Raman spectrum that can be easily distinguished in the complex biological media, so some additional labels or signal amplification approaches are necessary to prove the complex formation. For the most recognition elements, like antibodies, affine proteins, etc., a ternary complex formation is required to introduce SERS tags. Aptamers allow construction of conformational switch-based sensors. Briefly, the aptamer with a SERS tag, e.g. a conjugated resonant dye, is immobilized on the SERS-active surface, providing a SERS spectrum with the basic intensity. When the target binds the aptamer, the distance between the SERS tag and the surface is changed due to the conformational switch (Fig. 4). Small changes in the SERS tag-surface distance produce significant changes in SERS intensity that depends on the analyte concentration.[28-30]
![[{"id":"o_2V-b0tyB","type":"paragraph","data":{"text":"A schematic explanation of the SERS intensity changes during direct analyte binding by the aptamer (<i>a</i>). The changes in distance between Cyanine-3 (a SERS tag) and silver nanoparticles (SERS-active surface) affect SERS intensity of the Cyanine-3 bands in spectra (<i>b</i>). The Figure is adapted from Ref. 28 under the CC BY 4.0 license."}}]](/storage/images/resized/Zf6t3p7BJEycfPUFDlxHIvCJrIx9MazzfL19I4Ej_xl.webp)
As for the choice of the recognition element type depending on the SERS biosensor type, antibodies and other proteins are primarily used for SERS tags such as core–shell nanoparticles with resonant Raman molecules embedded between the core and shell. In the case of direct surface modification, the protein crown on the SERS-active surface does not allow chemical signal amplification mechanism, so the spectra of the analyte have low intensity and are often unavailable for the registration with the exception of resonant dyes.[31] On contrary, aptamers can be used for direct modification of SERS-active surfaces, as oligonucleotides have relatively small size, they are free of primary aliphatic amines or thiols, and as a result, cause much less decrease in SERS intensity of the analyte spectrum compared to protein-based recognition elements whose ‘crown’ decreases the probability of analyte-surface interaction and, hence, SERS spectrum intensity. Thus, a combination of aptamers as recognition elements and SERS as analytical technique provides new opportunities for the biosensors.[32]
Resonant dyes are of a particular interest for the SERS-based biosensors. SERRS tags include fluorescent and non-fluorescent dyes that efficiently absorb at the laser wavelength. These tags can be conjugated to the recognition molecule or form a temporary complex, whose formation depends on analyte concentration.[28][33][34] Significant improvements in Raman spectroscopy, SERS and SERRS techniques have led to their widespread use in biology.
Additional amplification strategies can be used to increase the signal. The most efficient approaches discussed in this review are catalytic hairpin and enzyme-based signal amplification. In most cases, these strategies are used along with SERS tags, SERRS tags or combining both approaches in the one pot. Catalytic hairpin assembly appears to be a particularly appealing nucleic acid circuit because of its powerful amplification capability, simple protocols, and enzyme-free and isothermal conditions, and can combine with various signal output modes for the biosensing of various analytes.[35][36] The basic model includes two complementary DNA sequences that do not form a duplex at an ambient temperature due to a high activation barrier. Commonly, the activation barrier occurs due to a hairpin-like secondary structure of one or both strands; the DNA hairpin can form a complex with an oligonucleotide that simultaneously stabilizes the hairpin and represents a transmitter in the free state. In the particular case of the genome detection, the target nucleic acid (RNA or DNA) binds and unfolds the hairpin liberating the transmitter. The transmitter unfolds the next hairpin H1 that forms a duplex with the complimentary sequence H2; the transmitter enters the cycle once more. The complex between H1 and H2 can be used as a target for SERS-based determination, for example, forming the complex H1-functionalized SERS-substrate with H2-functionalized SERS tag. As a result, a single molecule can generate up to hundreds of thousands molecular events on the biosensor. The same principle can be combined with aptamers as recognition elements (Fig. 5). In this case, the aptamer forms a complex with an oligonucleotide which is liberated in the presence of aptamer target. The further cycle-like process provides an amplification of the initial signal.[37][38]
![[{"id":"YOffLyxbXE","type":"paragraph","data":{"text":"Mechanism of catalytic hairpin assembly. This particular example implies an oligonucleotide P that is liberated from the complex with an aptamer in the presence of an analyte (<i>a</i>). Then the oligonucleotide P opens the hairpin H1 inducing an assembly of the complex between SERS substrate and H2-hairpin-modified SERS tag, whereas the oligonucleotide opens the next hairpin H1 (<i>b</i>). DTNB is 5,5'-dithiobis-(2-nitrobenzoic acid)."}}]](/storage/images/resized/5Qb5SVj0FFy0zwoitK8Bej9VpcppYOgEw8ShBxXk_xl.webp)
Enzyme-based amplification includes a variety of detection variants. For example, the most modern variants use CRISPR-Cas systems (CRISPR is clustered regularly interspaced short palindromic repeats, Cas is CRISPR associated nucleases). CRISPR-based nucleases are used as genome editing tools providing an efficient and simple analytical method for nucleic acid detection or any target detection in a combination with aptamers as recognition elements. Cas proteins can cleave single-stranded RNA or DNA after a specific recognition through Cas-associated RNA oligonucleotide. In several studies CRISPR-Cas system cleaved an oligonucleotide linker between the magnetic particle and the SERS tag or between two SERS tags only in the presence of the target sequence that decrease SERS signal (Fig. 6).[39-41] The catalytic hairpin and CRISPR-Cas can be combined together enhancing each other; in this case CRISPR-Cas product switch-on the catalytic hairpin cycle.[42] Other examples of enzyme-based amplification suggest the use of endonucleases (other than Cas), exonucleases, ligases, etc.[43-45] having much lower impact on this field up to date.
![[{"id":"GUVdNBqSAW","type":"paragraph","data":{"text":"Mechanism of CRISPR-Cas-based approach for target genome detection. A junction oligonucleotide joints a magnetic bead with a SERS tag. The enzyme cleaves the junction oligonucleotide in the presence of the target nucleic acid decreasing the SERS tag content near the magnet. MBs are magnetic beads; 4-ATP is 4-aminothiophenol."}}]](/storage/images/resized/N6XvdexWUDawsjsJvnBKrmHfrBnZpUGZnGfiVkUF_xl.webp)
4. Recognition elements for biosensors
4.1. Proteins
To implement rapid diagnostic standards, the efficient recognition elements are required. LFIA for pathogen detection uses antibodies. Antibodies are the most widespread recognition elements in modern diagnostics. Specific antigen-antibody interactions provide a possibility of analyte concentrating on the sensor in the presence a variety of the off-target components.
High-affinity antibodies are preferable as their complexes are more stable. Antibodies, depending on their production technique, can be polyclonal and monoclonal, including truncated variants (Fig. 7) such as scFv (variable domain of immunoglobulin G heavy and light chains) and VhH (variable domain of heavy chain of camelid antibody). Polyclonal antibodies (pAbs) contain a mix of molecules targeting different sites of the antigen and having different affinities. This approach is valid for situations where the target is a group of structurally related molecules, like highly variable viral proteins. The polyclonal antibodies have an inherent variability that is explained by the different immune statuses of experimental animals used for their production.
![[{"id":"YltZ5-pQKI","type":"paragraph","data":{"text":"Types of proteins used as recognition elements"}}]](/storage/images/resized/3gFKhUTpxExpXl6vRWUVoemTMqDLLgi0Pm5586y0_xl.webp)
Monoclonal antibodies (mAbs) originate from one precursor plasma cell targeting one epitope on the analyte and having defined affinity; the dissociation constants of antigen-antibody complexes are in the range of 10–13 – 10–8 M. mAbs can recognize several analytes if they share the same epitope. An advantage of mAbs is the possibility of standardization of antibody preparations. A concrete hybridoma cell line in mAb manufacture enables the stable production of antibodies and does not depend on the status of an animal, as is the case with polyclonal antibodies.[46]
Truncated antibodies are interesting for SERS-based applications, as their protein crown is smaller and Raman quenching is much lower compared to the full-sized antibodies. On the contrary, the development of stable truncated antibody is more labor-intensive than mAb production and is often accompanied with compromises in affinity and specificity.
Alternatively, other affine proteins with relatively low molecular weight can be artificially designed to the concrete analyte. DARPins (natural ankyrin repeats), affibodies (Z domain of staphylococcal protein A) and ABD (albumin-binding domain of streptococcal protein G) are small proteins (5 – 18 kDa) that can be selected or modified to bind the selected analyte. Their affinity and specificity are to be optimized achieving, in some cases, the antibody level.[46]
High variability of viral and bacterial antigens due to the antigenic shift and antigenic drift affects the robustness of the biosensors and test systems. IAV subtypes can be used as an example of the variability of surface epitopes and, as a result, requirements to antibodies that are necessary for the detection of hypervariable viruses. Structure and localization of the hemagglutinin antigenic determinants in different virus subtypes differ significantly. Some of the determinants partially overlap, whereas others are unique for the concrete subtype. In some cases, this fact is explained by the difference in the glycosylation profiles of the antigenic determinants. Due to conformational flexibility and structural variability, N-glycans can sterically block the protein surface within a 10 – 15 Å radius from the glycosylation site, decreasing the probability of antigen recognition by the antibody, if the screened regions overlap with antigenic determinants.[47]
Antibodies used in LFIA generally cannot be used for all known strains. The antibodies are screened to recognize the most common strains that are circulated in the population. IAV antigenic drift causes significant periodical mutations, and the same monoclonal antibodies can be used for identification of the IAV subtype for several years only. For example, antibodies against hemagglutinins A/Hiroshima/52/05 (H3N2) strain recognize all H3N2 strains isolated between 2000 and 2008, but cannot be used for the identification of earlier strains of this virus.[48-52]
Several modern studies aim to find antibodies that have affinity to multiple strains or even subtypes. These antibodies target, presumably, conserved regions on hemagglutinin, such as the receptor-binding site and the stem domain. Several mAbs to conserved hemagglutinin regions were identified, and the structures of their complexes with hemagglutinins were solved. However, the recognition is still selective showing good results for multiple strains within a given subtype, whereas much poorer results were acquired across multiple IAV subtypes.[53] One more interesting idea is to combine several antibodies to the conserved hemagglutinin regions into a single construction that has much higher affinity and good intersubtype recognition. However, these constructions as well as separate antibodies still have large variations in affinity to IAV of different subtypes with 10 – 100-fold differences.[54][55]
Specific natural proteins can be used instead of antibodies. For example, angiotensin converting enzyme 2 (ACE2) is a natural counterpart of spike protein of SARS-CoV-2, glycosylated proteins (e.g., fetuin) can be used to bind IAV and so on. The natural proteins are efficient and suit as recognition elements; however, each individual case requires a novel solution.
4.2. Nucleiс acid aptamers
Nucleic acid aptamers (or simply ‘aptamers’) are single-stranded synthetic nucleic acid molecules with a unique three-dimensional structure that provides specific and high affine binding to various molecular targets. Aptamers are artificial analogues of antibodies, since they perform the function of specific binding of the target. In addition, they demonstrate low toxicity and immunogenicity, increased stability during storage and transportation requiring no cooling or freezing, and can also be synthesized chemically, which reduces the cost of the production and simplifies the introduction of various modifications in a site-specific manner. One of the main limitations is their sensitivity to nucleases (DNA or RNA hydrolases). However, this problem can be solved by chemical modifications of the sugar-phosphate backbone in the 2' position of the ribose fragment of the nucleoside, or by creating spiegelmer enantiomers.[56][57] The ability of the aptamer to bind to the target molecule is determined by the 3D spatial structure into which the oligonucleotide is assembled. The variety of tertiary structures of the aptamers is shown in Fig. 8.
![[{"id":"5bpCBXpzgI","type":"paragraph","data":{"text":"The diversity of nucleic acid aptamer tertiary structures. Watson – Crick base pairs are shown in blue; unstructured parts are shown in green; G-quadruplexes are shown in red; non-Watson – Crick base pairs are shown in violet."}}]](/storage/images/resized/UYCq8C58Q4cgDSzx45BWkaR1E4u2ETBh9PueD21S_xl.webp)
A direct comparison of aptamers with antibodies to IAV referred above demonstrates the new possibilities to solve problems with viral protein variability. A lot of aptamers to IAV hemagglutinin were described;[58][59] some of them have narrow specificity binding several IAV strains only, whereas others have broad specificity binding nearly all IAV subtypes. For example, aptamer UHA-2 binds hemagglutinins from 5th, 7th and 9th subtypes with dissociation constants in the range of 1.5 – 10.1 nM (7.5-fold differences).[60] Nearly 10-fold differences in affinity are similar to the variability in antibody affinity to different IAV subtypes. More interesting example is aptamer RHA0385 that binds hemagglutinins from 1st, 3rd, 5th, 7th and 9th subtypes with dissociation constants in the range of 7 – 14 nM (2-fold differences). The same aptamer binds influenza A virions 3rd, 5th, 7th and 9th hemagglutinin subtypes with dissociation constants in the range of 2 – 8 nM (4-fold differences).[61] Thus, a single aptamer can have nearly the same affinity to a family of proteins. This result could be a consequence of small size of the aptamers comparing to antibodies. The small size of recognition element decreases the effect of the epitope shielding by glycosylation or mutations of neighboring residues.
A possibility of site-specific chemical modification is even more significant peculiarity of the aptamers compared to their specificity. Non-natural nucleotides expand the scarce 4-letter alphabet of natural nucleic acids, providing an enormous number of variants.[62-64] Several examples of popular modifications are listed in Fig. 9. The artificial nucleotides can be classified as following:
1. Modifications of the sugar ring, e.g., including 2'-F, 2'-NH2, 2'-OМе, cyclic (locked) and acyclic (unlocked) sugars are used to camouflage the aptamer against nucleases.
2. Modified phosphates, including those containing OCH3, S, SH, CH3, guanidine-like and other groups also increase the aptamer stability, but also change the conformations due to reduction in the electrostatic repulsion inside the sugar phosphate backbone. In some cases, these changes increase the affinity of aptamers to the target.
3. Modified heterocycles with a variety of additional functional groups, like primary amines, amino acids, alkynes, azides, peptides, aromatic rings, aliphatic groups, biotin, fluorophores and many others that increase the affinity, can be used as anchors for aptamer immobilization or reactive groups for further conjugating, including bioorthogonal chemistry.
4. Synthetic heterocycles mimicking the hydrogen bonds of natural nucleotides, for example, dDs – dPx base pairs [Ds: 7-(2-thienyl)-imidazo[4,5-b]pyridine, Px: 2-nitro-4-propynylpyrrole] and dZ–dP base pairs [dZ: 6-amino-5-nitro-3-(10-β-D-20-deoxyribofuranosyl)-2(1H)-pyridone, dP: 2-amino-8-(10-β-D-20-deoxyribofuranosyl)imidazo[1,2-a]-1,3,5-triazin-4(8H)-one], phenoxazines, etc. Synthetic heterocycles are used to increase the affinity and to provide a ligand-dependent change in the fluorescence.[65][66]
![[{"id":"jNvI9ZrB1m","type":"paragraph","data":{"text":"Modifications of nucleotides that can be introduced in the aptamers improving their properties. X: chemical formulas of substitutes in the α-phosphate group; Z: chemical formulas of substitutes in the C5-position of pyrimidines. The Figure is adapted from Ref. 57 with the permission from Springer Nature."}}]](/storage/images/resized/t5QEVcYcsQB8TViv8L72HJ8nFzBGezhhoK4770La_xl.webp)
The aptamers are unique due to the extended possibilities to create functional material with identically conjugated molecules that compose a uniform monolayer that are site-specifically modified with resonant Raman tags. As a result, aptamers allow construction of conformational switch-based sensors where SERS tag position depends on the conformation of the aptamer, which, in turn, depends on the binding of the analyte (see Fig. 4). Also, competitive assays can be designed where the target competes with a ligand or complimentary oligonucleotide for aptamer binding. These approaches are not accessible for proteins, making aptamers an interesting biotechnological tool for biosensors. The specific examples will be reviewed in the subsection 8.2 ‘Aptamer-based biosensors’.
5. Relevance of biosensors for the detection of pathogenic viruses and bacteria
5.1. Actuality of new methods of virus identification
Existing laboratory methods for diagnosing respiratory viruses include PCR with reverse transcription and LFIA (Fig. 10).[67] PCR has a LoD as low as 100 VP mL–1 (VP is viral particles).[68-71] However, sample manipulation and analysis require highly equipped laboratories and skilled operators, the whole process takes several hours. LFIA, on the other hand, is easy to use and provides results in 10 – 15 minutes. They are able to detect the target with a rather high detection limit, more than 105 VP mL–1; as a result, they omit 40 – 60% of infected patients having unacceptable accuracy level according to the recommendations of World Health Organization (WHO).[3-5]
![[{"id":"TQzCO4k6TR","type":"paragraph","data":{"text":"Common laboratory methods for the diagnosis of respiratory viruses. Analysis of viral genomes using polymerase chain reaction (<i>a</i>). Detection of the virions using lateral flow immunoassay (<i>b</i>). The panel <i>b</i> was adapted from Ref. 67 under the CC BY 4.0 license."}}]](/storage/images/resized/lsA33ftmlXxs1hi03fQmPSTMJBFnZR1Nv8irNPvs_xl.webp)
PCR with reverse transcription and real-time PCR with reverse transcription continue to be the gold standards for diagnosing the respiratory viruses. Both methods provide a quantitative determination of the viral pathogen with LoDs of 1000 copies mL–1 of viral RNA (reverse transcription and RNA instability increased the LoD), and a 100% specificity.[72] Also, the concrete viral strains can be discriminated which is particularly important when high-risk and low-risk strains are abundant in the population.[73]
The loop-mediated isothermal amplification (LAMP) technique enables rapid amplification of nucleic acids under low temperatures contrary to PCR. Due to its relatively short analysis time of 1 – 1.5 hours and the ability to use available equipment such as a water bath or UV lamp, LAMP has attracted significant attention from researchers. For example, one LAMP test system can detect the IAV with LoD of 100 VP mL–1 and specificity of 86.3%.[69] The reaction products can be detected through various methods, including gel electrophoresis, fluorescence or turbidimetry.[74]This method is under research, requiring reproducibility enhancement.
LFIA is a rapid assay type based on the recognition of viral antigens by antibodies. Primary antibodies are immobilized on a membrane, while secondary antibodies are attached to colloidal gold or colored latex particles. When the target virus is present in a sample, a ternary complex is formed, causing the test line coloring.[67][75] The test is simple to perform and does not require any special equipment or training, but low viral titers can be undetected due to weak coloring of the test line. Variability in viral antigens can also lead to false negative results, especially for certain strains. Despite these limitations, LFIA is often used in conjunction with PCR for preliminary PoC screening of patients. Rapid and sensitive PoC tests that are easy to use for respiratory virus detection are required.[76][77]
The variability of viruses presents additional challenges for testing systems. This is particularly significant for IAV detection. Two key antigens of IAV are the surface proteins hemagglutinin (HA) and neuraminidase (NA), and their combination determines the specific strain of the pathogen (18 variants of HA and 11 variants of NA), resulting in a large number of subtypes, designated as HxNy, such as H3N2.[47][78] Due to the high mutation rate of IAV viruses undergo antigenic drift, resulting from random mutations.[79] Additionally, antigenic shifts occur due to the random exchange of RNA fragments during coinfection of cells with two different IAV strains, further increasing the diversity of viruses.[47][78] The antigenic shift and antigenic drift can lead to a weakened immune response to repeated infections and decreased sensitivity of the diagnostic methods. SARS-CoV-2 has a similar rate of sporadic mutations, as a result, several lineages of the virus have been identified since 2019.[80][81]
There are several other ‘silent’ viral epidemics ongoing, including those of human immunodeficiency virus (HIV) and hepatitis, but the speed of testing for these viruses is not as significant as the diseases are often long-lasting, allowing for the detection of immunoglobulins M and G (IgM and IgG) along with the viral load.
5.2. Actuality of new methods in bacteria identification and antibiotic resistance testing
Another emerging problem is the rapid detection of antibiotic-resistant bacteria strains. Among resistant strains, the most dangerous are those that carry resistance genes for several classes of antibiotics simultaneously. Diseases caused by these strains have a significantly longer and more severe course, and are associated with a higher risk of death.[82] For example, an infection with methicillin-resistant Staphylococcus aureus (MRSA) increases chances of the lethal outcome by 50% compared to the infection with a sensitive strain.[83] WHO identified a number of carbapenem-resistant gram-negative bacteria as critical strains for the development of new antibiotics, due to their resistance to existing medications.[84] These include strains of Acinetobacter baumanii, Pseudomonas aeruginosa, and Klebsiella pneumoniae, which are known as pan-resistant strains. Currently the mortality rate associated with pan-resistant infections can be as high as 80%.[85] This highlights the urgent need for the development of new treatments for these resistant strains.
The rapid identification of antibiotic-resistant strains is complicated by our lack of knowledge about the resistance mechanisms. The specific genes are known in only about 30% of cases.[86] When treating bacterial infections, it is important to start etiotropic treatment as soon as possible, especially in case of septic shock or bacterial meningitis.[87][88] Empirical treatment regimens allow for quick initiation of treatment, but in cases of resistant infections, they may be ineffective.[89][90] Rapid method for antibiotic resistance testing is necessary having an applicability to a wide range of bacterial strains and antibiotics, and provides highly accurate results.
Current methods for determining bacterial antibiotic resistance include phenotypic and genotypic approaches (Fig. 11). Phenotypic methods provide accurate and reliable results within at least one day. Genotypic methods are limited to known antibiotic resistance genes, which account for approximately 30% of cases, and take several hours to complete.
![[{"id":"znYA-jyNSi","type":"paragraph","data":{"text":"Current methods for antibiotic susceptibility testing and turnaround time. The figure was adapted from Ref. 91 under the CC BY 4.0 license."}}]](/storage/images/resized/fDphNE6iLMbs39Iv6jyESh0kDTzndnUF22edzKcK_xl.webp)
Phenotypic methods determine bacterial resistance by measuring their ability to grow in the presence of antibiotics. The main advantage of this approach is absolute accuracy and direct measurement of antibiotic action on the bacteria that is a single case for unidentified resistance mechanisms. Also, phenotypic methods estimate the effectiveness of the antibiotics, determining the minimal inhibitory concentration (MIC).[91] However, the main drawback of these methods is their time-consuming nature, as they are limited with the growth rate of bacteria (on average, 24 h). This disadvantage is most prominent in slow-growing bacteria, such as Mycobacterium tuberculosis, whose growth of the culture can take up to four weeks and the same time is required to determine resistance.[92]
Genotypic methods rely on the identification of genes associated with resistance. These methods can use clinical samples directly allowing analysis without bacterial growth, making genotypic methods one of the fastest methods for detecting antibiotic resistance.[93] Genotypic techniques are particularly useful for slow-growing bacteria and for the cases where the specific genes associated with resistance are known. The main disadvantage of genotypic methods is insufficient coverage of resistance cases (approx. 30% of resistance-associated genes are known).[94] Additionally, even if a gene related to resistance is identified, genotypic tests cannot determine whether it is active or not. Genes can be inactive or have their function impaired due to mutations, which can lead to false positives.[95]
As a result, novel methods are required combining rapidness and accuracy of antibiotic resistance testing. This review describes current achievements in SERS-based biosensors for virus determination and drug-resistance testing.
6. Recognition of intrinsic pathogen SERS spectra
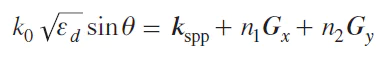
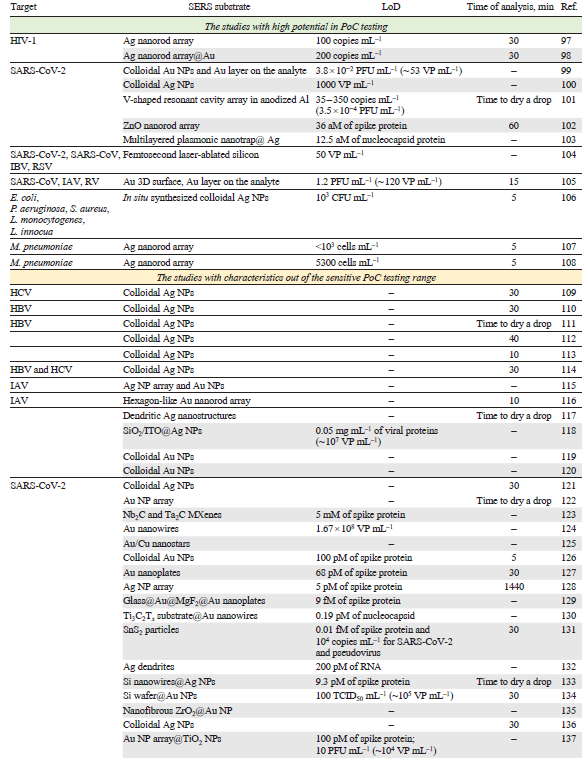
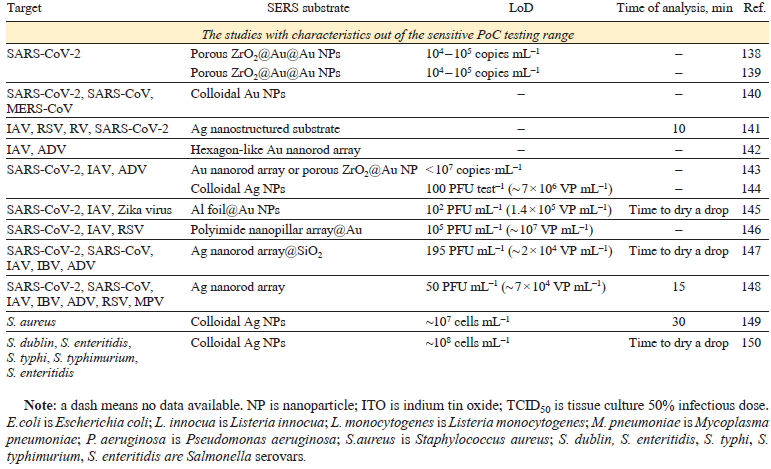
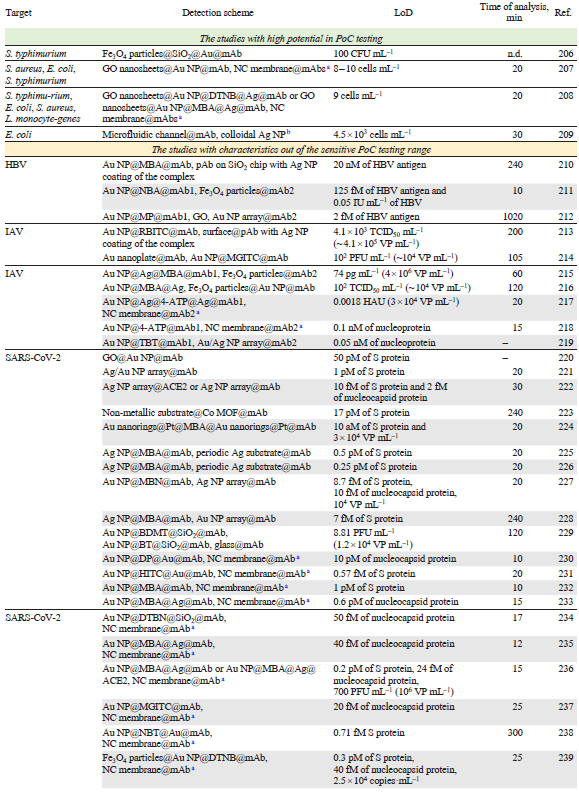
The intrinsic spectra of HIV, hepatitis B and С virus (HBV and HCV), influenza A and B virus (IAV and IBV), SARS-CoV-2, SARS-CoV, middle East respiratory syndrome coronavirus (MERS-CoV), rhinovirus (RV), human respiratory syncytial virus (RSV), metapneumovirus (MPV) as well as adenovirus (ADV) were studied on the different SERS substrates. In addition, a number of bacteria was identified (Table 1)[96-114][115-133][134-150]. Test-systems with parameters of sensitive PoC diagnostics (time of analysis ≤ 30 min, LoD ≤1000 pathogens mL–1) are discussed in details below. The concentrations of pathogens in the VPs and copies, as well as the CFU of bacteria, are of the same order of magnitude. For other units of measurement in the table and further in the text, the concentrations were recalculated using the ratios determined for the specific pathogen.
This type of test system requires high quality of SERS substrate as it responsible for the reproducibility of viral spectra. Fig. 12 shows the SERS substrates that provided rapid and accurate classification of the viruses. For example, silver nanorod array is highly ordered having high enhancement factor; it was used to obtain the intrinsic spectra of the viruses. Yadav et al.[97] studied HIV virions adsorbed on the spike-like silver surface. The spectra of five different HIV-1 subtypes (A, B, C, D, and CRF02_AG) had distinct signatures allowing discrimination of the X4 and R5 tropic strains (see Fig. 12). Different viruses are composed of the same type of biomolecules, namely, nucleic acids, proteins, lipids; as a result, principal component analysis (PCA) was applied to find some specific differences in band intensities. The viruses were successfully determined in the range of 102 to 106 copies mL–1 both in water and blood plasma. Further development of this work[98] includes comparing of three different types of SERS substrates: single-arm Ag nanorods, double-arm Ag nanorods and Au sputtered single-arm Ag nanorods. The maximum enhancement was obtained for Au sputtered Ag cylindrical nanorods. The test system can also differentiate between the clade specific X4 and R5 tropism with the similar LoD of 200 copies mL–1.
![[{"id":"otICFDiKbb","type":"paragraph","data":{"text":"The SERS substrates for acquisition of intrinsic SERS spectra of the viruses. Silver nanorod array allows HIV subtype decoding (<i>a</i>); other variants of SERS substrates that provide the viral intrinsic spectra acquisition (<i>b</i>)."}}]](/storage/images/resized/Yf34XfW4gRBf8GXNgetxi6vECAaZYHnnYYAgnfVK_xl.webp)
Silver nanoparticles were used for SARS-CoV-2 virus spectrum acquisition with LoD of 1000 VP mL–1.[100] However, the specificity of this approach was not studied. ZnO nanorod array coated with gold nanoparticles was used a SERS substrate to determine spike protein with LoDs of 36 aM in the buffer and 136 aM in saliva.[102] Multilayered plasmonic nanotrap with silver coating was used to detect nucleocapsid protein with LoD of 1.25 fg mL–1 (12.5 aM).[103] The inner viral proteins (e.g., nucleocapsid protein) generally are not susceptible for interaction with SERS substrates; the lysis of the virus is necessary to liberate the protein. At the same time, cell lysis that accompanied the viral cycle, releases significant amounts of the inner viral proteins; also, the variability of the inner viral proteins is much lower compared to surface proteins, so their determination is actual for many virus types.
Superior results were obtained using in situ SERS substrate formation in the presence of the analyte. Au coating was fabricated on the Si substrate through the spin-coating, then the analyte was adsorbed on the surface with subsequent coating with gold nanoparticles.[99] The LoD was as low as 3.8 × 10⁻² PFU mL−1 for SARS-CoV-2 in saliva. In situ SERS substrate formation provides higher SERS spectrum intensities, however, it can be inconvenient to assemble it with reproducibility in PoC applications.
V-shaped resonant cavity array in anodized aluminum were covered with gold layer and decorated with gold nanoparticles.[101] The intrinsic spectrum of spike protein was acquired and used a reference for further data handling. SARS-CoV-2 virus was determined with LoD of 35 – 350 copies mL−1 (3.5 10−4 PFU mL−1). The throat swabs from 35 confirmed COVID-19 patients (containing Alpha, Beta and Delta variants) as well as the throat swabs from 200 healthy people were tested with this approach using neural network for data processing. The discrimination between COVID-19 positive and negative patients had a sensitivity of 91.4% and a specificity of 95% with accuracy of 94.1%.
Femtosecond laser-ablated silicon was used as a SERS substrate to determine spike, nucleocapsid proteins and viral RNA.[104] The LoD of SARS-CoV-2 detection in saliva was 50 VP mL−1. The principal component analysis showed 94.3% similarity between the spectra of whole virus, RNA, spike protein, and nucleocapsid protein. SERS spectra of SARS-CoV-2, human coronavirus OC43, IBV and RSV were clearly discriminated with machine learning algorithms with 95.6% accuracy. 30 clinical samples were studied providing coincidence with PCR diagnostics.
Superior results were obtained using Au nanodimple substrates with a characteristic diameter of 110 nm that is similar to respiratory virus diameters.[105] The spectra were processed using machine learning, i.e. principal component analysis, support vector machine and convolutional neural network models. The viruses were trapped in three-dimensional plasmonic concave spaces via electrokinetic preconcentration, and Au films were simultaneously electrodeposited, leading to the acquisition of SERS signals from the Au — virus composites for ultrasensitive SERS detection. Eight viruses, including IAV H1N1 and H3N2 strains, RV and SARS-CoV were classified with 98.9% of accuracy. Electrokinetic preconcentration allowed achievement of LoDs of 1.2 PFU mL−1 (~ 120 VP mL−1) of IAV H1N1 strain, 5.5 PFU mL−1 of RV, 1.2 PFU mL−1 of SARS-CoV and 5.5 PFU mL−1 (~ 550 VP mL−1) of IAV H3N2 strain.
The combination of SERS with advanced machine learning techniques has opened new avenues for rapid and automated bacterial identification. In situ synthesis of Ag nanoparticles within bacterial suspensions was suggested for bacteria discrimination between species like E. coli, P. aeruginosa, Listeria, and MRSA, and could even differentiate between L. monocytogenes and L. innocua.[106] The LoD for L. innocua was 103 CFU mL−1, and the entire assay was completed within 5 minutes. The bacterial spectra contain bands from both cellular macromolecule components and metabolites. The detailed description of the metabolite identification is provided in the Subsection 10.2. ‘Bacterial metabolites for antibiotic resistance testing’.
Silver nanorod array was used as SERS substrate capable of detecting M. pneumoniae with statistically significant specificity and sensitivity in simulated and true clinical throat swab samples, and the ability to distinguish between reference strains of the two main genotypes of M. pneumoniae.[107][108] LoD was lower than 1 copy μL−1; and a quantitative multivariate detection limit was 5.3 cells μL−1.
Intrinsic spectra can be used for sensitive and reliable detection of pathogens. Different types of respiratory viruses can be discriminated; also, different lineages of the same virus type can be identified. Several successful attempts of clinical samples estimation confirmed the reliability of this approach.[101][104] However, due to low intensity of these spectra, sophisticated SERS substrates with complex geometry are necessary for this task, for example, excellent results were obtained on metal and non-metal nanorod arrays,[97][98][102][107][108] V-shaped resonant cavity array in anodized aluminum[101] and femtosecond laser-ablated silicon.[104] One more critical point is reproducibility of this SERS substrate as it affects the enhancement factor and imposes strict requirements on the quality control of substrates, making it difficult to implement methods.
7. Detection of pathogen genomes
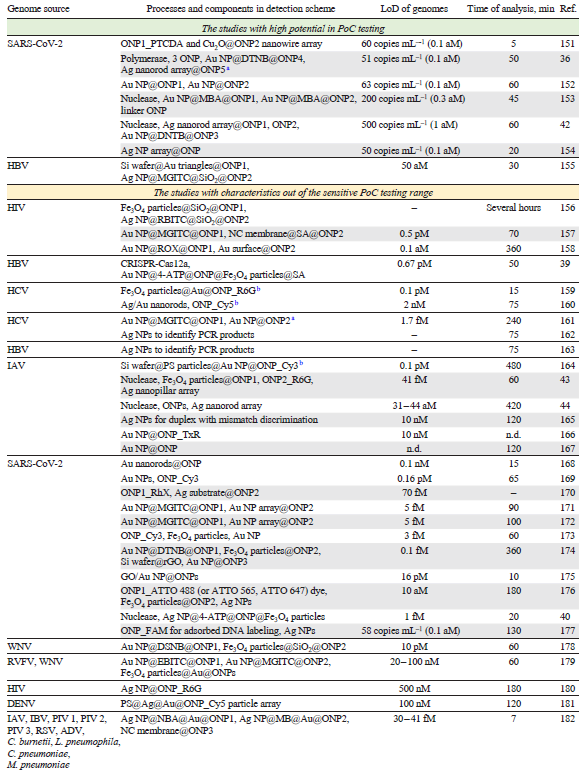
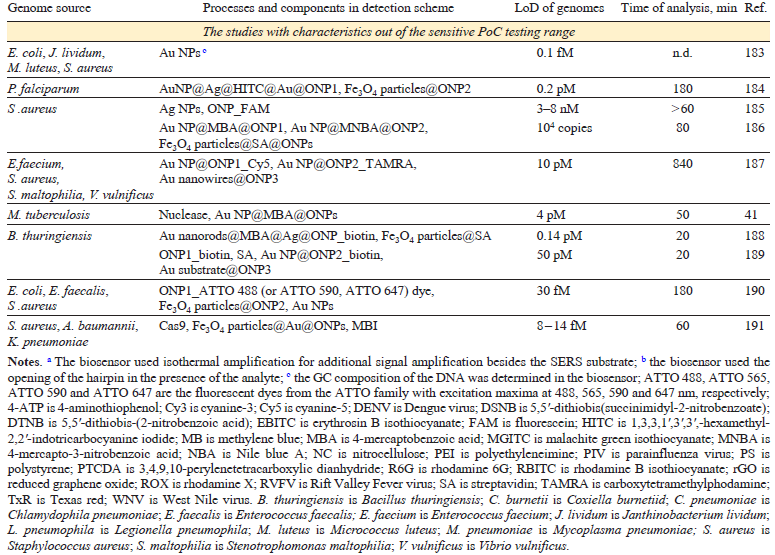
The nucleic acid spectra are very similar, so the nucleotide sequence is the only opportunity to discriminate pathogens reliably. Specificity of the sequence recognition can be provided by oligonucleotide probes (ONP). ONP bind complimentary genomes forming double helices stabilized with Watson – Crick base pairs. The highest specificity is achieved in sandwich-like complexes, where genomic nucleic acid binds two ONP simultaneously, concentrating SERS tags on the SERS substrate. The overview of the published studies is listed in Table 3[151-168][169-187][188-191]. The most successful studies that have parameters close to those of sensitive PoC systems (time of analysis ≤ 30 min, LoD ≤ 1000 pathogens mL–1 that is equal to 1 aM of nucleic acid) are discussed in details in the text below. Core-shell structures are commonly used in this type of sensors; their abbreviated description X@Y@Z means that X is a core that encapsulated in Y shell, and encapsulated once more in Z shell.
Isothermal amplification were used for accurate virus identification,[42] where SARS-CoV-2 RNA was cleaved by Cas13a enzyme, then bound the 1st hairpin-like oligonucleotide probe immobilized on the silver nanorod array surface. Then the 2nd hairpin-like probe bound the 1st one, liberating the Cas13a-produced fragments for the next reaction cycle. Thus, a single viral RNA produced multiple complexes between 1st and 2nd hairpins. The later complex was stained with SERS tags (gold nanoparticles with 5,5'-dithiobis-(2-nitrobenzoic acid) as a Raman reporter) that were functionalized with 3rd oligonucleotide probe. The LoD was 500 copies mL–1 (1 aM) with a capability to identify SARS-CoV-2 RNA gene mutations and discriminate SARS-CoV-2 from SARS-CoV and MERS-CoV.
CRISPR/Cas-powered SERS-based approach was suggested providing an amplification-free determination of SARS-CoV-2.[153] The SERS tags were made of gold nanoparticles with a Raman reporter (4-mercapthobenzoic acid) covered with 1st and 2nd oligonucleotide probes. The SERS spectrum of the colloidal solution showed bands, the intensity of which decreased in the presence of linker DNA which is complimentary to both oligonucleotide probes. Cas12a protein hydrolysed linker DNA in the presence of SARS-CoV-2 cDNA increasing SERS signal. Also, visual detection was possible, as gold nanoparticles has intense coloring. The assay detected SARS-CoV-2 with LoD of 200 copies mL–1 (0.3 aM). The clinical swab samples, environmental water, cold-chain food and food packaging were successfully tested.
RNA oligonucleotide probe complementary to RNA genome of SARS-CoV-2 was immobilized on the silver nanoparticle array.[154] Target RNA was bound producing intrinsic SERS spectrum (labeling was not used) with LoD as low as 50 copies mL–1 (0.1 aM) for SARS-CoV-2 with a quantification. Off-target RNAs did not interfere with the analysis.
Ternary complexes are usually used to detect viral genomes with high specificity, this type of analysis is also called ‘sandwich-like’ assay (Fig. 13). Unusual SERS substrate, Cu2O nanowires stacked into the array, which had an enhancement factor of 3 1010 was used for direct determination of SARS-CoV-2 in respiratory swab RNA extracts without any sample preparation.[151] The SERS substrate was modified hairpin-like oligonucleotide probe that forms a ternary complex with target RNA and 2nd oligonucleotide probe labeled with a Raman reporter (3,4,9,10-perylenetetracarboxylic dianhydride). The LoD was as low as 60 copies mL–1 (0.1 aM) within 5 min. 100 oropharyngeal RNA extract specimens collected from clinical samples (30 verified positive cases infected with Omicron BA.2, 30 verified positive cases with Omicron BA.5 with various virus titer, and 40 verified COVID-19 negative cases) were successfully tested with 100% sensitivity and specificity.
![[{"id":"Le-Pxqnxcq","type":"paragraph","data":{"text":"Assembly of ternary complexes allows double verification of pathogen genome as well as sandwich-like complex formation with approaching of SERS tags to the SERS substrate"}}]](/storage/images/resized/Bre7X6taorVp867HXhU3EDr4syhf2zOLe3DuXzEi_xl.webp)
Non-enzymatic isothermal amplification was proposed[36] using the following mechanism. The target RNA disrupts the complex between the 1st and 2nd oligonucleotide releasing the 1st oligonucleotide. Then, the 3rd oligonucleotide releases the target RNA, so the later one can participate in this cyclic process many times. The 1st oligonucleotide is captured by the 4th oligonucleotide that is immobilized onto the SERS substrate, namely, silver nanorod array. The staining was achieved in the ternary complex with a SERS tags (gold nanorods loaded with 5,5'-dithiobis-(2-nitrobenzoic acid)) functionalized with 5th oligonucleotide probe. The LoD was 51 copies mL–1 (0.1 aM) with a clear discrimination of SARS-CoV-2 RNA against other respiratory viruses (RSV, IAV, IBV, ADV) in representative clinical samples.
Impressive results were achieved for sandwich-like assay with SERS tags.[155] The target DNA induced assembly of the ternary complex resulting in SERS tags concentrated on the plasmonic surface. SERS tags were made up of silver nanoparticles covered with malachite green isothiocyanate as a resonant dye; silica shell enveloped the nanoparticles and was modified with oligonucleotide probe. The plasmonic substrate was a chip with an Au plane triangle nanoarray pattern on the Si wafer, which was fabricated with nanosphere lithography. The closest gap between two adjacent triangle dots was 190 nm providing properties of the periodic plasmonic substrate. The second oligonucleotide probe was immobilized on the surface of Au plane triangles. Sandwich-like assay supported specificity of the assay. A linear range from 0.5 to 100 fM was achieved for hepatitis B DNA, whereas the LoD was estimated to be 50 aM. This LoD is significantly lower compared to other biosensors; this biosensor has a potential of a few DNA molecule determination, approaching to polymerase chain reaction performance.
In another study, oligonucleotide probes were immobilized on gold nanoparticles; in the presence of viral RNA, the ternary complex can be assembled approaching two nanoparticles each of them was conjugated with the oligonucleotide probe.[152] These ternary complexes provide unique SERS spectra. Machine learning allows discriminating between clinically positive and negative COVID-19 nasal swab samples with 100% sensitivity and 90% specificity with LoD of 63 copies mL–1 (0.1 aM) of SARS-CoV-2 RNA concentration.
Summarizing, SERS-biosensors is a promising approach for pathogen genome detection. Its high sensitivity allows detection of DNA at subattomolar concentrations, thus enabling direct measurements without preliminary PCR amplification steps. SERS also enables simultaneous detection of multiple genetic targets in a single sample. At the same time, the techniques are rather sophisticated containing 2 – 6 components for highly sensitive detection. An average time of analysis is much higher compared to determination of intrinsic spectra of pathogens with rare exceptions. Therefore, this approach is not optimal for PoC applications.
8. Specific identification of viral and bacterial proteins
Recognition elements allow specific detection of pathogen markers that are proteins in the most cases. Antibodies and aptamers are the most commonly used in biosensors; other recognition proteins were used in specific cases, like ACE2 for SARS-CoV-2; all of them were included in antibody-based biosensors.
8.1. Antibody-based biosensors
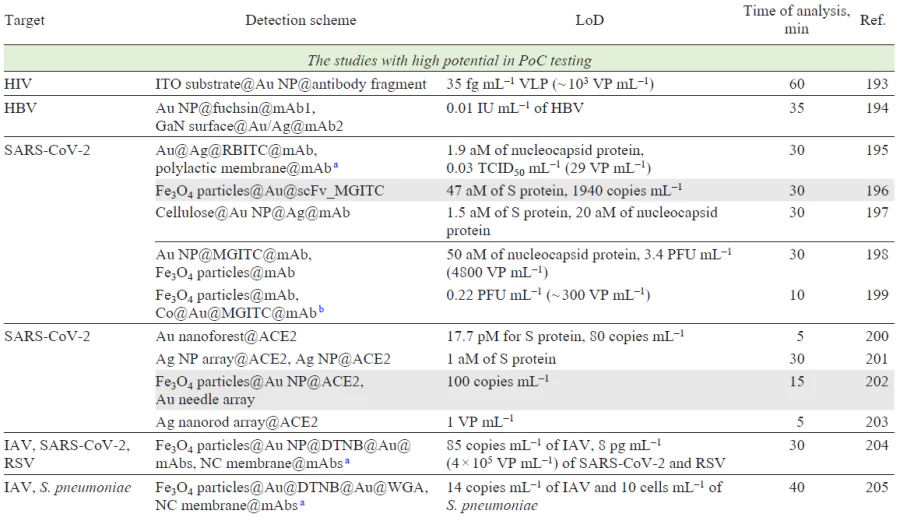
The main characteristics of the antibody-based sensors are listed in Table 5[192-210][211-226][227-245][246-256]. The most successful studies that have parameters close to those of sensitive PoC systems (time of analysis ≤30 min, LoD ≤1000 pathogens mL–1 that is equal to 10 – 1000 aM of viral proteins) are discussed in details in the text.
Antibodies to glycoprotein 120 (GP120) were used to perform a specific adsorption of the HIV virus-like particles on the SERS substrate (Au nanoparticles on indium tin oxide).[193] The virus-like particles were caught with LoD of 35 fg mL–1 (~103 VP mL–1) that approaches to LoD of PCR (20 – 200 copies mL–1).[257] However, real samples and off-target viruses were not studied.
Ag nanoparticle array on graphene and silver nanoparticles were modified with ACE2.[201] The ternary complex was formed to obtain the intrinsic spectrum of spike protein with LoD of 0.1 fg mL–1 (1 aM).
Outstanding results were reported[200] using ACE2‑functionalized gold nanoforest SERS substrate for spike protein binding and detection of the intrinsic spectrum of the protein or the virus. The LoD were 17.7 pM for spike protein and 80 copies mL–1 for SARS‑CoV‑2 virus. Similarly, silver-nanorod array was functionalized with ACE2 having strong SERS signals of the protein.[203] The band intensities were decreased significantly during receptor binding domain of spike protein. The biosensor detected SARS-CoV-2 virus in water samples containing > 0.75 VP mL–1.
A highly sensitive immunoassay was proposed combining elaborated SERS tags and a microfluidic device.[194] Fuchsin has intense SERS spectra on the gold nanoparticles being a promising Raman reporter. Gold nanoflower is an oligomer of several gold nanoparticles with strong SERS enhancement. The fuchsin-labeled antibody-modified Au nanoflowers can form a sandwich structure with the hepatitis B virus surface antigen captured by the second antibody immobilized on the planar SERS-active substrate. For the further enhancement of the SERS, Au – Ag coated GaN surface was used as the planar SERS-active substrate. As a result, the LoD for Hepatitis B virus antigen was estimated to be 0.01 IU mL–1; whereas, the current LoDs in the whole blood and blood components samples ranges from 0.03 to 0.62 IU mL–1. The SERS immune-assay had a linear range of 0.0125 – 60 IU mL–1 reflecting clinically relevant HBsAg titers (0.125 – 25 IU mL–1). The SERS-based immunoassay was proven to be used for the detection of hepatitis B virus surface antigen in human serum and plasma samples.
Successful attempts to create SERS-LFIA were reported. LFIA with SERS tags was used to determine nucleocapsid protein of SARS-CoV-2.[195] The SERS tags were made up of Au@Ag that were loaded with rhodamine B isothiocyanate and functionalized with antibodies to nucleocapsid protein. The ternary complex was assembled on the antibody functionalized membrane with LoD of 1.9 aM of nucleocapsid protein and 0.03 TCID50 mL–1 (29 VP mL–1 as recalculated according to Ref. 96) of SARS-CoV-2 virus diluted in the nasal swab. The robustness of the test system for virus detection was achieved due to scanning of the test line with the microscope measuring all virus-bound SERS tags. The idea of microscope scanning of the test line is very fruitful as the separate clusters of SERS tags provide much more accurate quantitative information compared to the averaged signal (Fig. 14).
![[{"id":"SsakNn90cS","type":"paragraph","data":{"text":"Illustration of the digital LFIA employing the core-shell SERS tags for the sandwich immunoassay for the detection of the SARS-CoV-2 spike protein. (<i>a</i>) Assembly scheme of the sandwich-like complexes on the test line. (<i>b</i>) SERS tags loaded with Raman reporters. (<i>c</i>) A scheme of digital SERS which counts separate events instead of averaging of the whole test line surface. Reprinted with a permission from Ref. 238 ©2022 American Chemical Society."}}]](/storage/images/resized/FK1r0vOGUzFo0nHbeKtOyA0lXK9fxmDrdk39fAub_xl.webp)
LFIA was integrated with two-dimensional film-like SERS labels.[207] Au-shell-coated graphene oxide nanosheets acted as superior labels compared to spherical nanoparticles. They feature a large surface area, adhered effectively to bacterial cells, and showed excellent dispersibility on the strip, overcoming the challenges posed by the large size of bacteria in LFIA. This enabled the multiplex detection of three foodborne bacteria (S. aureus, E. coli O157:H7, S. typhimurium) on a single strip with LoDs as low as 8 – 10 cells mL–1 in just 20 minutes, marrying the high sensitivity of SERS with the rapid, user-friendly format of LFIA.
The further research used Ag nanoparticles deposited onto Au-shell-coated graphene oxide nanosheets.[208] Furthermore, two different Raman reporters (DTNB and 4-MBA) were used on the nanosheets as well as different antibodies to detect four pathogens on only two test lines. The LoDs were of 9 cells mL–1, which makes this approach promisingfor high-throughput, on-site pathogen screening.
The Au@Ag nanoparticles were embedded into porous cellulose and used as a SERS substrate.[197] Antibodies to spike protein and nucleocapsid protein were used for specific detection of these proteins. SARS-CoV-2 spike protein was determined with LoD of 100 ag mL–1 (1.5 aM), nucleocapsid protein was determined with LoD of 1 fg mL–1 (20 aM).
Very simple technique was suggested using labeled antibodies instead of SERS tags.[196] Magnetic particles with gold shells were modified with scFv to SARS-CoV-2 spike protein, the same antibody was labeled with a resonant Raman reporter (malachite green). The magnet was used to separate the magnetic particles with the ternary complexes with viruses. The LoDs were 1940 copies mL–1 of SARS-CoV-2 and 4.7 fg mL–1 (47 aM) of spike protein in saliva.
In another work, magnetic particles were covered with gold nanoparticles and functionalized with ACE2.[202] Au nanoneedle array was used as SERS substrate to obtain the intrinsic spectra of ACE2. Support vector machine and principal component analysis were used for the analysis of the intrinsic spectra of the proteins. The LoD was as low as 100 copies mL–1 of pseudovirus.
A combination of SERS tags and magnetic particles was suggested. Gold nanostars were loaded with a resonant Raman reporter (malachite green isothiocyanate) and functionalized with antibodies to SARS-CoV-2 nucleocapsid protein.[247] The magnetic particles were also functionalized with antibodies to SARS-CoV-2 nucleocapsid protein providing a possibility of ternary sandwich-like complex which was separated using a magnet. The assay had LoD of 5 PFU mL–1 (7000 VP mL–1 as recalculated according to Ref. 96). Lately, this biosensor was shown[198] to have LoD of 2.56 fg mL–1 (50 aM) for the SARS-CoV-2 nucleocapsid protein and 3.4 PFU mL–1 (4800 VP mL–1 as recalculated according to Ref. 96) for the SARS-CoV-2 lysates. The time of analysis was decreased getting in the PoC range. Clinical samples were also studied showing satisfactory correlation with PCR results.
Microfluidics with SERS-tags was also proposed for SARS-CoV-2 determination.[199] Magnetic particles were functionalized with antibodies to SARS-CoV-2 nucleocapsid protein. SERS tags were created using Co@Au loaded with a resonant Raman reporter (malachite green isothiocyanate); the tags were functionalized with antibodies to SARS-CoV-2 nucleocapsid protein. Magnetic particles bound nucleocapsid protein forming a ternary complex with a SERS tag. The decrease of SERS tag concentration in the supernatant was measured using microdroplet formation and estimation SERS spectrum intensity in each microdroplet individually (~ 140 droplets). The LoD was as low as 0.22 PFU mL–1 (~ 300 VP mL–1 as recalculated according to Ref. 96). A selectivity was shown toward IAV, IBV and RSV.
To develop an automated detection system for bacteria, microfluidics was used.[209] A flow-through microarray cell for the online SERS detection of antibody-captured E. coli was suggested. A closed compartment reduces contamination risk and handling time. By immobilizing specific antibodies on a PEG-coated surface within a microfluidic channel, bacteria were captured from a sample stream and subsequently detected label-free by staining with silver nanoparticles. Using SERS mapping of a carbohydrate vibrational mode, the quantification was achieved within a linear range of 4.3 × 10³ to 4.3 × 10⁵ cells mL–1. While this LoD of ~ 4500 cells mL–1 was insufficient for applications like drinking water safety, the work was fundamental, because it proved the feasibility of fabrication of integrated, automated SERS immunoassays and further highlightedg the need to improve the sensitivity of SERS spectra and develop more robust signal generation strategies.
A combination of the efficiency of magnetic separation with the simplicity of LFIA approach (Fig. 15) was proven to be very efficient for multiple pathogen detection.[204] The SERS-based LFIA with magnetic particles was designed to detect three respiratory viruses, namely IAV H1N1 subtype, SARS-CoV-2 and RSV. Magnetic particles were covered with gold nanoparticles, 5,5-dithio-bis-(2-nitrobenzoic acid) (a Raman reporter), 2nd gold nanoparticle layer and, finally, antibodies to viral proteins. The dual gold layer offered approximately three times stronger SERS signals than the monolayer. Nitrocellulose membrane with the immobilized antibodies caught the complexes of the target viruses with magnetic SERS tags. Each target had its own test line with a possibility of specific determination with LoDs of 85 copies mL–1 for IAV H1N1 subtype, 8 pg mL–1 (4 × 10⁵ VP mL–1 taking virus molecular weight as 107 Da) for SARS-CoV-2 and RSV. The specific detection of the viruses was verified in throat swab samples.
![[{"id":"dxmWcAoD5e","type":"paragraph","data":{"text":"(<i>a</i>) A scheme of synthesis of SERS-active magnetic particles loaded with Raman dye and functionalized with antibodies; (<i>b</i>) a scheme of the magnetic SERS strip for detecting two respiratory viruses, IAV and ADV. Reprinted with a permission from Ref. 253 ©2019 American Chemical Society."}}]](/storage/images/resized/EleXa3OMmmMYHpsjmd0IejdPLVvoTXzLKhlOe7VG_xl.webp)
Infection with IAV often leads to secondary infection with Streptococcus pneumoniae (S. pneumoniae). SERS-LFIA was developed to determine both pathogens simultaneously.[205] Wheat germ agglutinin was used as a broad-spectrum recognition molecule adsorbed onto magnetic SERS tags (Fe3O4 covered with two gold shells that surround DTNB used as a Raman reporter). The test strip was modified with antibodies to IAV and S. pneumoniae. The magnetic particles were used to separate the targets from throat swab/sputum samples, and then these complexes were captured separately by IAV-specific antibody on T1 line or S. pneumoniae-specific antibody on T2 line. The visual detection was performed with LoDs of 1000 copies mL–1 and 1000 cells mL–1; SERS detection LoDs were 14 copies mL–1 and 10 cells mL–1. More than 100 clinical samples were studied, including throat swabs and sputum samples with a diagnostic accuracy of 100%.
The multifunctional popcorn-shaped magnetic core–plasmonic shell (Fe3O4@SiO2@Au@mAb) nanoparticles were synthesized.[206] These nanoparticles were conjugated with M3038 antibodies specific for multidrug resistant S. typhimurium DT104. The platform enabled targeted magnetic separation and a 20-fold enrichment of the bacteria from solution. The antibody-conjugated nanoparticles formed aggregates on the bacterial surface, creating SERS ‘hot spots’ that allowed for label-free SERS detection and imaging of the bacteria with a sensitivity as low as 100 CFU mL–1. The SERS spectrum of S. typhimurium DT104 showed characteristic bands, e.g., 1460 cm–1 (CH2 bond deformation of saturated lipids). Furthermore, upon NIR laser irradiation, the localized photothermal heat generated by the nanoparticles selectively destroyed the captured multidrug resistant bacteria, demonstrating a combined diagnostic and therapeutic ‘theranostic’ approach.
The typical time of analysis in antibody-based biosensors is significantly lower compared to biosensors aiming genome identification. At the same time, the complexity of the immunosensors is significantly higher compared to other biosensor and test system types. SERS and SERRS tags are used in the majority of the sensors; these tags are often multilayered core-shell-like structures with high reproducibility of the signal due to the encapsulation of the dye inside the particle. A combination of the tags with magnetic separation, microfluidic devices or LFIA expands the robustness of the biosensors. One more critical point in antibody usage is connected with the variability of the pathogen determinants (e.g., antigenic shift and antigenic drift of the were discussed earlier) which restricts the applicability of antibody-based biosensors to several subtypes or strains of the same pathogen.
8.2. Aptamer-based biosensors
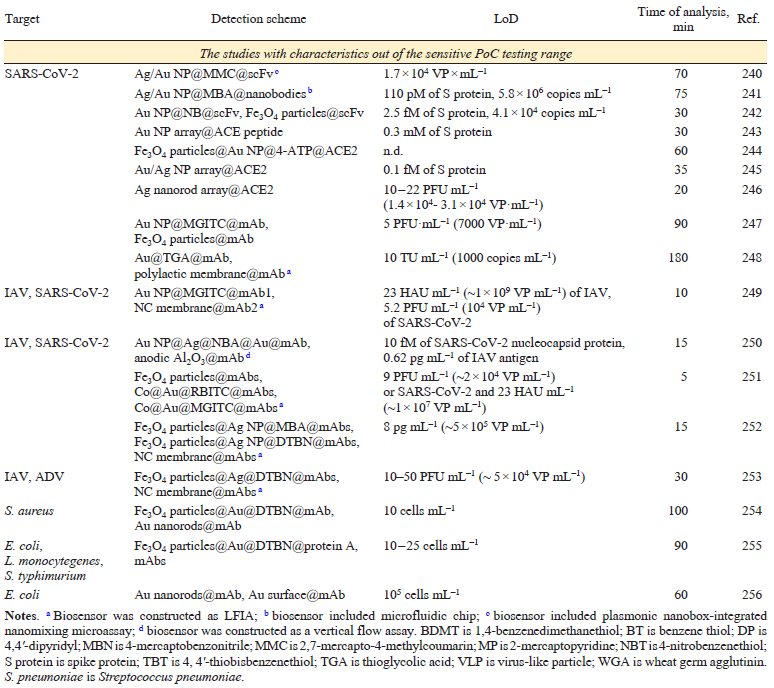
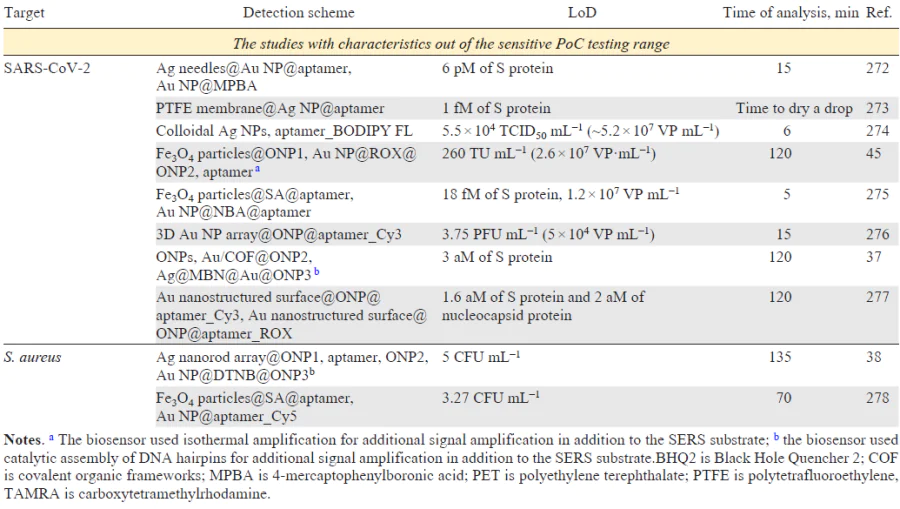
A brief description of aptamer-based biosensors, so called aptasensors, is provided in Table 8[258-276][277, 278]. The text discusses in detail the most successful results of studies that have parameters comparable to those of sensitive PoC systems (time of analysis ≤30 min, LoD ≤1000 pathogens mL–1 that is equal to 10 – 1000 aM of viral proteins).
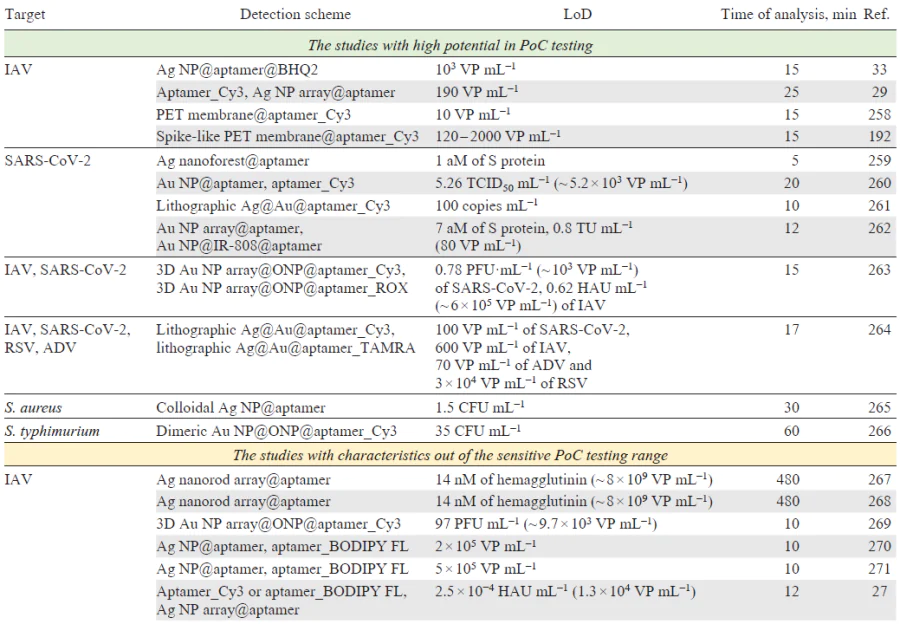
Aptamer-modified silver nanoparticles were used with a competitive approach;[33] a resonant Raman reporter (Black Hole Quencher 2) formed a complex with the aptamer, the SERS spectra of which featured intense bands after the aggregation of nanoparticles. IAV competed with Raman reporter for the aptamer binding site, thus, IAV decreased SERS intensity (Fig. 16). As aggregation of silver nanoparticles is sensitive to the presence of proteins in biological medium, membrane filtration was used to wash out the impurities from a real sample (virus-containing allantoic fluid). As a result, the aptasensor detects IAV in the range of 1 × 10³ – 5 × 10¹⁰ VP mL–1 with the LoD of 1 × 10³ VP mL–1 and with no cross-reaction with IBV.
![[{"id":"v3dhC_C8AX","type":"paragraph","data":{"text":"Schematic representation of the aptasensor with competitive mechanism of IAV detection. Molecules are filtered off through the membrane, and IAV displace the resonant Raman reporter from the complex with the aptamer decreasing the SERS signal in the probe. The Figure is adapted from Ref. 33 under the CC BY 4.0 license."}}]](/storage/images/resized/YZahFuBbV8ZisyPlRftG1AxXOMzNbnvbjhR3APGM_xl.webp)
Silver nanoparticles deposited on the planar substrates represent a SERS substrate that is compatible with flow cells, thereby it can also be easily washed out of impurities. The DNA aptamer was used to create sandwich-like complex.[29] The aptamer was immobilized on the SERS substrate (an array of Ag NP on the Si@SiO2 substrate) and bound IAV viruses; then the complex was stained with the aptamer labeled with a resonant Raman reporter (Cyanine-3). The quantification was achieved in the range of 190 – 6 × 10⁶ VP mL–1 with a LoD of 190 VP mL–1.
The complexes were covered[260] with silver layer to increase SERS intensity of the ternary complexes of aptamer-modified gold particles with SARS-CoV-2 viruses and Cyanine-3-labeled aptamers to spike protein. The LoD was 5.26 TCID50 mL–1 (~5.2 × 10³ VP mL–1) of pseudotyped SARS-CoV-2 virions.
‘Sandwich’-like assay was proposed using gold nanoparticle array as a SERS substrate and SERS tags, both modified with aptamer to spike protein.[262] SERS tags were composed of gold nanoparticles loaded with near-IR fluorescent heptameric cyanamide dye (IR-808). The ternary complex generated ultra-strong ‘hot spots’ achieving LoDs of 0.7 fg mL–1 (7 aM) for spike protein and 0.8 TU mL–1 (80 VP mL–1) for pseudovirus particles.
Further attempts to decrease LoD were performed using SERS membranes which combine features of analyte concentrating, recognition and signal enhancement in the one-step process.[258] The silver nanoisland surface was created on polyethylene terephthalate track-etched membrane with replacing the sandwich-like complex to binary ‘aptamer – virus’ complex. The SERS signal was provided by a resonant Raman reporter (Cyanine-3) that was conjugated with the aptamer. SERS intensity depends on the distance between the dye and the surface. During IAV binding SERS intensity changes as the aptamer conformation changes, or the dye is shielded by the virus (Fig. 17). Both SERS intensity and surface-enhanced fluorescence were used for virus detection with similar robustness. The limit of detection for the biosensor was as little as 10 VP mL–1 of IAV.
![[{"id":"7k0NV8R3HF","type":"paragraph","data":{"text":"Mechanism of reporter reorientation during the performance of the SERS membrane. Random orientation of the aptamer with the reporter toward the surface (<i>a</i>); filtration of virus-free liquid (a buffer solution) modified the surface providing a negatively charged surface with increased distance between the reporter and the surface (<i>b</i>); during the filtration of the virus-containing solution, specific interactions between aptamers and viral particles occur orienting the reporter in the common manner near the surface (<i>c</i>). The Figure is adapted from Ref. 258 under the CC BY 4.0 license."}}]](/storage/images/resized/uGBMo4ovqzGG58uv3Xmg17X9idT6H3aFZVPiB4x3_xl.webp)
SERS membrane can be created by depositing the metal layer on the intrinsically structured surfaces. Polyethylene terephthalate track membrane was etched to produce mm-scaled spikes on its surface.[279] The magnetron sputtering of silver layer produced reproducible regular SERS membrane. Similarly to the previous study, the membrane was functionalized with Cyanine-3 labeled aptamer. The aptasensor 192 successfully detected H1N1, H3N2 and H7N1 subtypes of influenza A virus with LoDs 120 – 2000 VP mL–1 and wide detection range (5 folds of the magnitude). Notably, the LoDs correlated with aptamer affinity to the virus; the quantification was not achieved. Direct comparison with PCR indicated that the membrane bound nearly 2 × 10⁴ VP mL–1 IAV from the sample with 4 × 10⁴ VP mL–-1 titer. Additionally, the real clinical samples, namely, nasal swabs, were tested. The aptasensor detected the virus in the sample from the 1st day of the manifestation of symptoms, the same result was proven by PCR and LFIA. The samples at 4th day of the manifestation of symptoms were negative in PCR and LFIA, but still provided a positive result with aptasensor, indicating its superior Performance in low-titer samples.
Lithographic SERS substrates composed of hundred-nm scale Si column array were covered with silver and gold layers and functionalized with aptamer modified by a resonant Raman reporter, Cyanine-3.[261] The SERS intensity of the reporter was changed during virus binding providing LoD of 100 copies mL–1. The sensor had no cross-reaction with RSV subtype A2 and ADV subtype 3.
A multisensor was created using the similar approach.[264] Four resonant Raman reporter-labeled aptamers were immobilized on the different zones of the lithographic SERS substrate described above. The target virus binding affected the aptamer conformation changing SERS intensity of the reporter. As a result, four respiratory viruses were determined simultaneously. The LoDs were 100 VP mL–1 for SARS-CoV-2, 600 VP mL–1 for IAV, 70 VP mL–1 for ADV and 3 × 10⁴ VP mL–1 for RSV. The use of the sensor helped to decode mixes of these viruses.
The aptamers were immobilized onto silver nanoforest SERS substrate, and changes in the intrinsic aptamer spectrum were observed during the target protein binding.[259]The LoD was 1 aM for the spike protein. The use of the aptasensor allowed to detect SARS-CoV-2 in clinical samples with variants of concern, including the wild-type, delta, and omicron variants. Eighty clinical nasopharyngeal samples were studied with nearly 100% of sensitivity.
Dual-mode aptasensor was developed to distinguish IAV and SARS-CoV-2.[263] DNA aptamers to IAV hemagglutinin and SARS-CoV-2 S protein were used as recognition elements. The complimentary oligonucleotides were immobilized on the gold nanopopcorn (3D Au NP array) SERS substrate. The aptamers were modified with two resonant Raman reporters (Cyanine-3 and rhodamine red-X), thus, duplex formation between the aptamer and the complimentary oligonucleotide produced SERS signal. Additionally, the internal Raman reporter (4-mercaptobenzoic acid) was immobilized on the Au nanopopcorn substrate (3D array of Au NP) to reduce errors caused by changes in the measurement environment. When the target virus bound the aptamer, the later one detached from the surface decreasing SERS intensity. The use of the sensor enabled a quantitative evaluation of the target virus concentration with LoDs of 0.78 PFU mL–1 for SARS-CoV-2 and 0.62 HAU mL–1 (~ 6 × 10⁵ VP mL–1, the virus titer recalculation was performed using the ratio for H1N1 virus reported in Ref. 192) for IAV.
In situ synthesis of silver nanoparticles around S. aureus labeled with aptamer dramatically improved intrinsic spectra achieving a remarkable LoD of 1.5 CFU mL–1.[265] This method eliminated the need for complex data analysis and made analysis simpler and more sensitive. However, its reliance on the variable intrinsic bacterial signal and amplification mechanisms posed challenges for uniform quantification across different bacterial strains and complex media.
Asymmetric dimeric gold nanoparticles were assembled using DNA hybridization, placing the Raman reporter (Cyanine-3) within a predictable and consistent electromagnetic ‘hot spot’.[266]The introduction of S. typhimurium triggered the disassembly of these dimers, leading to a measurable signal decrease. This competitive displacement mechanism provided a robust quantitative readout, with an LoD of 35 CFU mL–1, and proved effective in the analysis of complex food samples like milk.
To conclude, aptamer-based biosensors have much simpler design compared to antibody-based ones. In many cases, the simplification is achieved due to two peculiarities: 1) the direct immobilization of the aptamers on the SERS substrate without significant decrease in enhancement factor and 2) introduction of resonant dyes in the aptamer structure that leads to significant simplification of SERS tag creation. Several works used unique mechanisms that were not used in antibody-based biosensors, such as conformational switch of the aptamer where the analytical signal is created due to the change in dye-substrate distance in the presence of the analyte,[258][261][264] as well as a competition between target and ligand/complimentary oligonucleotide for aptamer binding.[33][263][266][269][275] Aptamer-based biosensors can be combined with isothermal amplification of catalytical hairpin amplification, however the time of analysis was significantly longer (several times)[37][38][45] than the analysis time of much more simple and rapid aptamer-based biosensors with resonant dyes; the later ones are compatible with PoC requirements in terms of the time of analysis and LoDs.
9. The effect of the recognition elements onto biosensor performance
SERS was proven to be a powerful method for rapid and sensitive analysis. Its combination with the use of recognition elements enhances the robustness and specificity of the techniques for pathogen detection. The detection of the viral and bacterial pathogens can be performed with parameters of PoC systems. Different approaches were used for SERS biosensor construction. Briefly, reproducible SERS substrates with high enhancement factor can be supplemented with resonant Raman dye to produce high intensity of Raman spectra. Also, magnetic separation, membranes or microfluidic devices can be used to concentrate the samples. Traditional LFIA can be improved significantly using SERS tags with Raman reporters and magnetic separation.
The effect from the use of recognition elements was estimated by a direct comparison between unmodified SERS substrates and three variants of biosensors (Table 10, Fig. 18). This analysis summarized data for the virus detection from Table 1,Table 3,Table 5,Table 8.
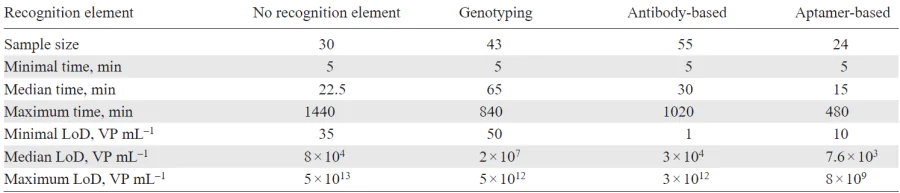
![[{"id":"pzFxFszPqb","type":"paragraph","data":{"text":"A comparative analysis of the robustness of biosensors with different recognition elements and test systems without the recognition element (the latter one encoded as ‘no recognition element’) in virus determination: median time (<i>a</i>) and LoD (<i>b</i>)"}}]](/storage/images/resized/ly87Ttzp3gYt0kxkFAinZI32I9PwqdIvGCMoZqCa_xl.webp)
All types of the biosensors have large variations both in the time of analysis and LoDs. Using median values for comparison, we can conclude that genotypic tests are the slowest (median time is 65 minutes) and the less sensitive (median LoD = 2 × 10⁷ VP mL–1). Other three approaches provided similar characteristics that are rather close to each other as well to the PoC characteristics. The lowest median LoDs and times of analysis were found for the aptamer-based sensors convincing on the practice the exceptional applicability of the aptamers for SERS applications. Even aptasensors’ median values were close to ideal PoC characteristics, namely, the median time of analysis was 15 min, whereas the median LoD was 7600 VP mL–1. This direction is of especial interest for the further clinical implementation attempts for determination of a variety of targets, as aptamers can be used as highly specific recognition elements both for protein and low-molecular-weight analytes.
10. Determination of pathogen phenotype: SERS-based biosensors and test-systems for drug resistance determination
10.1. Drug resistance of viruses
As it was discussed in the subsection 5.1 ‘Actuality of new methods of virus identification’, the antigenic shift and antigenic drift alter the surface proteins, as a result, both immune defense and drug susceptibility can be disrupted allowing viruses to circumventing natural and artificial protection approaches. There are several examples of specific antivirals and a few examples of biosensors that allow determination of viral susceptibility to the drug.
An interesting approach was suggested to discriminate drug-resistant IAV. Oseltamivir is an inhibitor of neuraminidase; the resistance to oseltamivir is spreading decreasing the drug efficiency. Au nanoparticles were functionalized with oseltamivir hexylthiol and malachite green isothiocyanate (a resonant Raman reporter) simultaneously.[280] The pH1N1/H275Y mutant virus has extremely high binding affinity to oseltamivir hexylthiol compared to wild-type H1N1. The target virus induced aggregation of Au nanoparticles providing visual change in color at virus titer of 1000 PFU mL–1 (~ 105 VP mL–1). The aggregation induced SERS intensity of the Raman reporter with LoD of 10 PFU mL–1 (~ 103 VP mL–1). Remarkably, the mixtures of mutant and wild-type viruses were successfully discriminated with similar LoDs even in a mixture of mutant and wild-type viruses with a ratio of 1/100. The oseltamivir-functionalized Au nanoparticles were adsorbed on the glass surface decreasing LoD down to 1 PFU mL–1 (~ 102 VP mL–1).[281] pH1N1/H275Y mutant viruses were spiked into the collected clinical samples (nasal fluid and saliva) from healthy individuals. The use of the biosensor helped to detect mutant virus in the samples with IAV titers similar to those in clinical samples (104 PFU mL–1 (~ 106 VP mL–1)).
10.2. Bacterial metabolites for antibiotic resistance testing
As stated in subsection 5.2. ‘Actuality of new methods in bacteria identification and antibiotic resistance testing’, the rapid identification of antibiotic-resistant strains is complicated by our lack of knowledge about the resistance mechanisms. The specific genes are known in only about 30% of cases.[86] The phenotypic methods provide almost 100% of specificity and sensitivity even in the cases, when the mechanism is unknown. The brief summary of the most common resistance mechanisms includes 1) antibiotic inactivation by enzymes; 2) antibiotic target alteration; 3) duplication of the target with another biomolecule; 4) decreased uptake; 5) active antibiotic efflux from the cells.[282] Antibiotic (antimicrobial) susceptibility testing (AST) determines the susceptibility of a bacteria to a panel of antibiotics; the results of the testing are typically reported as MIC values or categorical interpretations (susceptible, intermediate, or resistant). The rapid detection and reliable identification of pathogens have become a paramount focus in numerous fields, including food safety, public health monitoring, disease diagnosis, and environmental protection.[283][284]
SERS biomarkers were reported for bacterial AST of S. aureus ATCC 29213 and E. coli ATCC 35218 as well as clinical isolates of several other bacterial species.[285] For the Gram-positive bacterium S. aureus, the Raman spectrum band at 730 cm–1 was identified as a key biomarker signal for monitoring antibiotic effect. For the Gram-negative bacterium E. coli, two bands at 654 and 724 cm–1 served as the effective biomarkers that were registered using a silver nanoparticle array within anodic aluminum oxide nanochannels as a SERS substrate (Fig. 19). The molecule responsible for the appearance of the band at 730 cm−1 in the spectra of S. aureus was supposed to be adenine and/or its derivatives, while the bands at the 654 and 724 cm−1 in the spectra of E. coli probably originate from guanine, hypoxanthine and/or their derivatives, respectively. The method was validated by testing methicillin-susceptible S. aureus strain with oxacillin and wild-type E. coli strain with imipenem, both β-lactam antibiotics that inhibit bacterial cell wall synthesis. The decrease of these signals was more pronounced in susceptible bacteria compared to their resistant counterparts, allowing for clear differentiation. The MIC was determined by measuring spectra of the samples within a range of antibiotic concentrations having a good correlation with traditional cultural techniques with a typical time of 2 hours. The bacterial titer was in the range 106 – 108 CFU mL–1.
![[{"id":"h-tL5cnW29","type":"paragraph","data":{"text":"SERS spectra of different species of Gram-positive (<i>a</i>) and Gram-negative (<i>b</i>) bacteria exhibiting the prominent 730 and 654/724 cm<sup>–1</sup> bands, respectively. The Figure is adapted from Ref. 285 under the CC BY 4.0 license."}}]](/storage/images/resized/2znm2TaGntnS4E4khou1PFP3o0q2GHsQ7mLr7PqB_xl.webp)
The subsequent study[286] involved eight common bacterial pathogens (S. aureus, S. epidermidis, E. faecalis, E. faecium, E. coli, E. cloacae, K. pneumoniae, A. baumannii) and seven commonly administered antibiotics. The overall time of analysis was 2 – 5 hours; the bacterial titers were adjusted to 3 × 10⁹ CFU mL–1 for SERS measurements. The protocol demonstrated a high level of agreement: 96% for Gram-positive and 97% for Gram-negative bacteria. The characteristic drop in the biomarker signal was observed for susceptible isolates across different classes of antibiotics, including β-lactams (oxacillin, cefotaxime), glycopeptides (vancomycin), and quinolones (levofloxacin).
The dominant SERS signals from bacteria under starvation conditions originate from purine derivative metabolites, namely, adenine, hypoxanthine, xanthine, guanine, uric acid, and adenosine monophosphate, which are released as part of bacterial purine salvage pathways in response to nutrient stress. This assignment was convincingly supported by comparing bacterial SERS spectra with those of pure purine derivatives, as well as data of ultra-performance liquid chromatography with electrospray ionization mass spectrometry of bacterial supernatants and studies on defined bacterial mutants. It was confirmed[287][288] that when bacteria are transferred from a nutrient-rich environment to water (simulating the washing steps in SERS-AST protocols), they immediately begin releasing these molecules. The release rates were found to be species-dependent. A single S. aureus or E. coli bacterium was estimated to release approximately 106 purine derivative molecules during the sample preparation for SERS-AST.
Continuing this research, Liao et al.[289] focused on achieving full automation and single-device integration by developing an automated microfluidic control system for SERS-AST. Their platform featured a microwell device that was seamlessly operated by programmable syringe pumps and selector valves to execute all steps, including antibiotic rehydration, on-chip bacteria culture, buffer washing, and in situ SERS measurement, without any manual intervention. A key innovation was the use of an ‘air isolation’ process to confine bacteria and reagents within individual microwells during buffer exchange, effectively creating thousands of parallel micro-reactors. The research established a correlation between the SERS signal intensity at 733 cm–1 and bacterial concentration from 107 to 1010 CFU mL–1. For the antibiotic susceptibility testing, susceptible and ampicillin-resistant E. coli were treated on-chip with a gradient of antibiotic concentrations for three hours. The results showed a clear, concentration-dependent response: for the susceptible strain, signal dropped markedly at 32 μg mL–1 of ampicillin, indicating effective growth inhibition, while the signal for the resistant strain remained unchanged across all concentrations.
Chang et al.[290] addressed a key limitation of earlier SERS-AST methods — the requirement for a lengthy pre-culture to obtain a high bacterial concentration — by developing a microfluidic system integrating membrane filtration with a SERS-active substrate. This system was designed to perform on-chip bacterial enrichment, metabolite collection, and in situ SERS measurements. Using E. coli as a model, the platform demonstrated a remarkable detection limit of 103 CFU mL–1, which is four orders of magnitude lower than methods based on centrifugal purification. This significant enhancement drastically reduces the required pre-culture time. The microfluidic device operates through a sequence of filtration, washing, incubation, and detection steps within a closed environment, which minimizes contamination and human error associated with manual sample handling. The closed microchannel environment ensured a stable adsorption – desorption equilibrium of metabolites on the SERS substrate. The AST capability was successfully demonstrated by distinguishing between kanamycin-susceptible and kanamycin-resistant E. coli strains at a very low initial concentration of 103 CFU mL–1. The key metric, the ratio of the metabolite signal at 740 cm–1 after antibiotic treatment, dropped significantly for the susceptible strain (to ~ 0.25) after two hours, while it remained near 1.0 for the resistant strain.
Another study[291] reported E. coli O157:H7 strain and S. aureus with the in situ synthesis of silver nanoparticles on the bacterial surface. This process generated a strong and characteristic intrinsic SERS spectra with a prominent band at 735 cm–1. The intensity of this band directly correlated with bacterial concentration, as demonstrated for dilutions ranging from 103 to 108 CFU mL–1. The key finding of this work was the ability to determine MIC within one hour with good correlation with the standard broth dilution method. The study uncovered a notable ‘enhancement effect’ when bacteria were exposed to antibiotics in sub-MIC concentrations. For both E. coli O157:H7 treated with tigecycline and S. aureus treated with vancomycin, the SERS signal intensity at 735 cm–1 after 1 – 2 hours of exposure was significantly higher than that of the control bacteria grown without any antibiotic. This effect was observed with four different antibiotics for each bacterial species, including amikacin, ciprofloxacin, and polymyxin B for E. coli, and ciprofloxacin, chloramphenicol, and erythromycin for S. aureus. Crucially, this increase in SERS signal correlated with a verified increase in the CFU mL–1 count, suggesting that sub-MIC levels of antibiotics under certain conditions may stimulate bacterial growth or metabolic activity rather than simply inhibiting it. The authors hypothesized that this could be due to a transient inhibitory effect on bacterial respiration that is followed by a rebound increase in activity and replication, a factor that must be considered when evaluating new antibiotic drugs in vitro.
10.3. Bacterial intrinsic spectra for resistant strain identification
Intrinsic SERS spectra of the bacteria can be used for typing of the resistant strains. The intrinsic spectra include bands from the bacterial components and secreted biomolecules, so they partially overlapped with the spectra discussed in the previous subsection. A recent study[292] adopted a Vision Transformer model, a deep learning architecture, for bacterial SERS spectral analysis. The model was trained on a large dataset of 11 774 SERS spectra obtained directly from clinical blood culture samples with further bacteria lysis. The model achieved exceptional accuracy: viz., 99.30% for classifying Gram type and 97.56% for identifying bacterial species, even distinguishing between species with very similar spectra like E. cloacae and K. pneumonia. Furthermore, methicillin-resistant S. aureus was differentiated from methicillin-susceptible S. aureus directly from their intrinsic SERS spectra with accuracy of 98.5%. This demonstrates the potential of deep learning to not only identify bacteria but also to predict antibiotic resistance without the need for a separate AST incubation step. The bacterial titer was adjusted to 6 × 10⁸ cells mL–1. Also, deep learning analysis of SERS data is able to differentiate the response of untreated cells from those exposed to antibiotics in 10 min post exposure with 99% accuracy.
SERS substrate composed of silicon nanowires covered with silver nanoparticles was used to acquire reproducible Raman spectra from bacterial samples at concentrations as low as 100 CFU mL–1.[293] A database of SERS spectra of 12 different bacterial species, including pathogens responsible for tuberculosis (M. tuberculosis H37Ra) and urinary tract infections (E. coli, K. pneumoniae, S. aureus) was described. The spectra revealed distinct molecular fingerprints attributable to key cell wall components such as mycolic acids in mycobacteria, adenine-related compounds from nucleic acids, and specific proteins and lipids that allowed for differentiation between Gram-positive and Gram-negative species. A Siamese neural network model was used to classify these SERS spectra being effective across a wide range of bacterial concentrations (102 to 106 CFU mL–1). Furthermore, the SERS substrates enabled strain-level differentiation, successfully distinguishing wild-type E. coli from two antibiotic-resistant E. coli strains (A2-39 and NCTC 13441). The SERS spectra of the resistant strains exhibited additional and shifted bands, for instance at 1101, 1183, and 1623 cm–1, which were correlated with their resistance profiles as confirmed by whole-genome sequencing. This suggests that the SERS spectrum captures the determinants of antibiotic resistance. The platform’s clinical utility was underscored by its ability to detect E. coli directly in synthetic urine at clinically relevant concentrations (105 CFU mL–1) down to 100 CFU mL–1, with an analysis time of just 20 minutes.
10.4. Determination of bacterial genes related to antibiotic resistance
In a genotypic approach, a platform was created that used magnetic beads, recombinase polymerase amplification and SERS detection for the ultrasensitive identification of specific carbapenemase resistance genes (vim, kpc, imp). The recombinase polymerase amplification was performed on the surface of streptavidin-coated magnetic beads producing an immobilized duplex amplicon featuring a unique single-stranded overhang for each target gene.[294] This overhang is then hybridized with detection probes, enabling a dual readout via an enzyme-linked oligonucleotide assay for colorimetry and, more importantly, high sensitive and quantitative estimations using SERS. The SERS probes were designed, consisting of gold nanoparticles labeled with distinct Raman reporters. The LoDs were 0.01 – 0.26 pM; the time of analysis was 2 hours. The three gene-specific SERS probes were combined into a single ‘multiplex SERS probe’ and tested it against samples containing various combinations of the target genes with good specificity. A sensor for tetracycline resistance gene tetA detection was created using similar hairpin-based SERS probe and reaching LoD of 3 pM.[295]
Using the ability of Ag nanoparticles to absorb ssDNA, but not dsDNA, a sensor was made which detects target sequences by its hybridization with Raman labelled complementary probe.[185] In the absence of target DNA, the single-stranded probe adsorbs onto the nanoparticle, generating SERS. In the presence of the target, the probe hybridizes with it, the complex does not adsorb onto the nanoparticle, and SERS is not observable. This approach is simpler than molecular sentinels, as it does not require specific stem-loop forming probes and their immobilization on the surface. Based on this principle, a multiplex sensor, containing three types of DNA probes with different Raman dyes is made, which could detect and distinguish methicillin-resistant and methicillin-susceptible S. aureus strains
10.5. Tetrazolium-based AST
Some tetrazolium salts, such as MTT (3-(4,5-dimethylthiazol-2-yl)-2,5-diphenyltetrazolium bromide), XTT (2,3-bis-(2-methoxy-4-nitro-5-sulfophenyl)-2H-tetrazolium-5-carboxanilide), and WST-8 (water-soluble tetrazolium 8), can be reduced in living bacteria by NAD(P)H (reduced nicotinamide adenine dinucleotide or nicotinamide adenine dinucleotide phosphate) dependent reductases to colored formazan products. The activity of these enzymes depends on bacterial viability; thus, their inhibition of bacterial metabolism by an antibiotic decreases the amount of formazan produced. While the colorimetric detection of formazan is a widely used method, the insolubility of some formazans (which requires time-consuming dissolving steps) and interference from sample components with optical density readings limit the assay’s accuracy and performance. Raman spectroscopy, resonance Raman spectroscopy, and SERS quantify formazans based on their characteristic spectra directly in the sample with high specificity, making them preferable approaches.
An AST based on MTT assay and Raman spectroscopy has been developed.[296] Bacteria were incubated with an antibiotic for 1 hour, followed by incubation with MTT for another 30 minutes. After incubation, the Raman spectra of the samples were collected using a spectrometer with a 637 nm excitation wavelength that is resonant for MTT formazan. When resistant bacteria were treated with the antibiotic, the intensity of the formazan spectrum did not change significantly with increasing antibiotic concentration. However, for a sensitive strain, a rapid decline in the formazan signal was observed. The MICs of antibiotics were determined as the concentrations at which the band intensity drops to 50 – 60% of that in the reference sample for E. coli and K. pneumoniae with good correlation with broth dilution. The bacterial titer was adjusted to 6 × 10⁸ CFU mL–1. The minimum bacterial concentration at which the formazan spectrum was detectable by resonant Raman spectroscopy was 107 CFU mL–1.
Other tetrazolium salts, XTT and WST-8, which are also common in microbiological practice, were tested for applicability in resonant Raman spectroscopy-based AST.[297] It was shown that the Raman spectrum of XTT formazan shows signals of a very low intensity and therefore could not be used in the assay. WST-8 formazan yields an intense signal with a spectrometer using 532 nm excitation light and can be used to evaluate bacterial susceptibility, yielding MIC values almost identical to those from MTT-based assay. However, compared to the MTT formazan spectrum, the intensities of the characteristic bands of WST-8 formazan were lower in samples with the same bacterial concentration, so MTT remains the preferable reagent.
High bacterial concentration limits assay performance in PoC applications, making measurements of samples with lower concentrations impossible without preliminary colony growth. To overcome this problem, SERS-based approaches are being developed, using colloidal nanoparticles or track-etched polyethylene terephthalate membranes with a SERS-active layer. For SERS-based formazan detection, silver nanoparticles are not suitable because they reduce MTT non-enzymatically, producing an intense formazan spectrum even in the absence of active bacteria.[298] Gold nanoparticles have lower enhancement factors compared to silver nanoparticles, but they do not reduce MTT and can be used for formazan detection in bacteria. Furthermore, nanoparticle aggregation is a crucial factor, as it generates ‘hot spots’ that significantly increase signal intensity. Conversely, nanoparticle shapes or coatings that increase their stability in colloidal sols significantly decrease the formazan signal intensity. The use of spherical gold nanoparticles reduces the minimum required bacterial concentration to 3 × 10⁵ CFU mL–1.[299]
SERS of bacterial samples on track-etched polyethylene terephthalate membranes with a silver nanoparticle array is much more sensitive than spectroscopy using colloidal nanoparticles due to a larger quantity of hot spots and a complex structure that provides stronger plasmon resonance.[300] The bacterial sample was filtered through the membrane, and bacteria were retained on the SERS-active surface, coming into a contact with silver nanoparticles. These membranes allow for the acquisition of SERS spectra from individual cells, enabling the collection of statistics on individual cell responses instead of an integral measurement (Fig. 20). The minimum bacterial concentration required for SERS measurements on the membrane was 100 CFU mL–1. The antibiotic resistant strains were discriminated from the susceptible strains with reliable MIC determination.
![[{"id":"6efAleg_Sw","type":"paragraph","data":{"text":"Membrane filtration for SERS-based AST. Scheme of the assay: (<i>a</i>) formazan-stained bacteria accumulate on the surface of the membrane with a SERS-active layer; (<i>b</i>) a single bacterial cell on the membrane surface; (<i>c</i>) SERS spectrum of the single cell."}}]](/storage/images/resized/1W4oNbO1w8tmHKOzzu8z2ohUOpu6mHBsZIu7IVsE_xl.webp)
Concluding this part of the review, SERS-based biosensors were created for the specific identification of resistance-associated biomarkers. However, taking into account the huge variability of the resistance mechanisms, phenotypic determination seems to be much more suitable. SERS-based test systems allow phenotypic determination of bacterial antibiotic resistance by usage of the both intrinsic pathogen spectra (namely, differences in secreted metabolites) and resonance dye production by the cells with LoDs that meet PoC criteria, namely 102 – 103 CFU mL–1.[290][291][300] These tests-systems are promising as they can omit cultivation step decreasing the time of analysis from 1 – 3 days to several hours. In this case SERS serves as a powerful analytical method for detection of the countable number of bacteria in the sample.
11. Conclusion
Surface-enhanced Raman spectroscopy has firmly established itself as a cornerstone technology for the next generation of ultrasensitive, rapid, and specific biosensors and test systems for pathogen diagnostics. This review has comprehensively outlined the transformative role of SERS that moved from a sophisticated laboratory technique to the point-of-care (PoC) applications during last several years. SERS provides the requisite sensitivity to detect pathogens at clinically relevant concentrations, often as low as a few virions or bacteria in the probe, within timeframes compatible with on-site decision-making (under 30 minutes).
The critical analysis presented herein demonstrates that the successful integration of SERS into diagnostic platforms hinges on a combination of three core elements: 1) highly reproducible and enhancement-optimized SERS substrates (e.g., nanorod arrays, lithographic nanostructures, or in situ formed nanoparticles); 2) robust recognition elements (antibodies, aptamers, or oligonucleotide probes) that confer specificity in complex biological matrices; and 3) intelligent analyte concentrating, signal generation and amplification strategies (e.g., magnetic separation, membrane or microfluidic technologies, SERS tags, catalytic hairpin assembly, CRISPR-Cas systems).
The comparative analysis of different biosensor and test system architectures reveals distinct profiles. While intrinsic SERS fingerprinting offers a direct, label-free approach; its success heavily relies on ultra-uniform substrates and advanced machine learning for spectrum deconvolution. The biosensors can achieve the same results without sophisticated SERS substrates and tricky data processing. Genomic biosensors, utilizing oligonucleotide probes, achieve exceptional specificity and reach attomolar sensitivities but often at the cost of time-consuming, multi-step assay protocols. Immunosensors use the high affinity and specificity of antibodies that can be combined with various approaches of analyte concentrating and lateral flow formats, etc. Notably, aptamer-based SERS biosensors (aptasensors) emerge as a particularly promising frontier. As our analysis evidenced (see Fig. 18, Table 10), they frequently achieve the best balance between PoC requirements: the lowest median analysis time of 15 minutes and the lowest median limit of detection of 7.6 × 10³ VP mL–1. In general, aptamer-based systems are much simpler compared to antibody-based ones.
SERS showcases a unique and powerful capacity for phenotypic characterization, most critically in determining antibiotic resistance. Traditional phenotypic AST, the gold standard, is slow. SERS-based test systems elegantly address this task by detecting resistance-associated changes in bacterial metabolism. This can be achieved either by monitoring the evolution of intrinsic SERS spectra from bacterial cells or by quantifying specific secreted metabolites (e.g., purine derivatives) or the reduction of viability indicators. These approaches can provide susceptibility results within 1.5 – 5 hours, bypassing the need for overnight culture and offering a direct functional readout that covers both known and unknown resistance mechanisms.
Thus, SERS has evolved from a fascinating physical phenomenon into a versatile and powerful analytical engine for pathogen diagnostics. At present, SERS-based biosensors and test systems meet or exceed the key sensitivity, speed, and specificity criteria for PoC applications. Their dual capability for sensitive pathogen identification and rapid drug susceptibility testing positions them as a transformative technology poised to address some of the most pressing challenges in global health, from combating pandemic viruses to mitigating the silent epidemic of antibiotic resistance. These capabilities promote the transition of the laboratory proofs-of-concept into validated, commercially available tools that can reshape the landscape of clinical microbiology and public health surveillance.
This work was supported by the Russian Science Foundation, grant No. 24-65-00015, https://rscf.ru/project/24-65-00015 in the part about biosensors for bacteria. Also, JINR project 07-5-1131-3-2025/2029 supported in the part about biosensors for virus.
12. List of abbreviations
ABD — albumin-binding domain of streptococcal protein G,
ACE2 — angiotensine converting enzyme 2,
ADV — adenovirus,
Аffibodies — Z-domain of staphylococcal protein A,
AST — antibiotic susceptibility testing,
4-ATP — 4-aminothiophenol,
B. thuringiensis — Bacillus thuringiensis,
BDMT — 1,4-benzenedimethanethiol,
BHQ2 — Black Hole Quencher 2,
BT — benzenethiol,
C. burnetii — Coxiella burnetiid,
C. pneumoniae — Chlamydophila pneumoniae,
Cas — CRISPR associated nucleases,
CB — conduction band,
CFU — colony-forming units,
СНА — catalytic hairpin assembly,
COF — covalent organic frameworks,
CRISPR — clustered regularly interspaced short palindromic repeats,
Cy3 — cyanine dye 3,
Cy5 — cyanine dye 5,
DARPins — natural ankyrin repeats,
DENV — dengue virus,
DP — 4,4'-dipyridyl,
dP — 2-amino-8-(10-β-D-20-deoxyribofuranosyl)imidazo[1,2-a]-1,3,5-triazin-4(8Н)-one,
Ds — 7-(2-thienyl)imidazo[4,5-b]pyridine,
DSNB — 5,5'-dithiobis(succinimidyl-2-nitrobenzoate),
DTNB — 5,5'-dithiobis-(2-nitrobenzoic acid),
dZ — 6-amino-5-nitro-3-(10-β-D-20-deoxyribofuranosyl)-2(1Н)-pyridone,
E. coli — Escherichia coli,
E. faecalis — Enterococcus faecalis,
E. faecium — Enterococcus faecium,
EBITC — erythrosin B isothiocyanate,
FAM — fluorescein,
HA — hemagglutinin,
HBV — hepatitis B virus,
HCV — hepatitis C virus,
HITC — 1,3,3,1',3',3',-hexamethyl-2,2'-indotricarbocyanine iodide,
HIV — human immunodeficiency virus,
HOMO — the highest occupied molecular orbital,
IAV — influenza virus A,
IBV — influenza virus B,
IgG — immunoglobulin G,
IgM — immunoglobulin M,
ITO — indium tin oxide,
J. lividum — Janthinobacterium lividum,
L. innocua — Listeria innocua,
L. monocytogenes — Listeria monocytogenes,
L. pneumophila — Legionella pneumophila,
LAMP — loop-mediated isothermal amplification,
LFIA — lateral flow immunoassay,
LoD — limit of detection,
LUMO — the lowest unoccupied molecular orbital,
M. luteus — Micrococcus luteus,
M. pneumoniae — Mycoplasma pneumoniae,
mАb — monoclonal antibodies,
MB — magnetic bead,
MBA — 4-mercaptobenzoic acid,
MBN — 4-mercaptobenzonitrile,
MBl — methylene blue,
MERS-CoV — middle east respiratory syndrome coronavirus,
MGITC — malachite green isothiocyanate,
MIC — minimal inhibitory concentration,
MMC — 2,7-mercapto-4-methylcoumarin,
MNBA — 4-mercapto-3-nitrobenzoic acid,
MP — 2-mercaptopyridine,
MPBA — 4-mercaptophenylboronic acid,
MPV — metapneumovirus,
MRSA — methicillin-resistant Staphylococcus aureus,
МТТ — 3-(4,5-dimethylthiazol-2-yl)-2,5-diphenyltetrazolium bromide,
NA — neuraminidase,
NADPH — reduced nicotinamide adenine dinucleotide or nicotinamide adenine dinucleotide phosphate,
NBA — Nile blue,
NBT — 4-nitrobenzenethiol,
NC — nitrocellulose,
NP — nanoparticles,
ONP — oligonucleotide probe,
P. aeruginosa — Pseudomonas aeruginosa,
рAb — polyclonal antibodies,
PCA — principal component analysis,
PCR — polymerase chain reaction,
PEI — polyethyleneimine,
PET — polyethylene terephthalate,
PIV — parainfluenza virus,
PS — polystyrene,
PTCDA — 3,4,9,10-perylenetetracarboxylic dianhydride,
PTFE — polytetrafluoroethylene,
Px — 2-nitro-4-propynylpyrrol,
R6G — rhodamine 6G,
rGO — reduced graphene oxide,
RBITC — rhodamine B isothiocyanateЃВ,
ROX — rhodamine X,
RS — Raman scattering,
RSV — human respiratory syncytial virus,
RV — rhinovirus,
RVFV — Rift Valley fever,
S. aureus — Staphylococcus aureus,
S. dublin — Salmonella dublin,
S. enteritidis — Salmonella enteritidis,
S. maltophilia — Stenotrophomonas maltophilia,
S. pneumoniae — Streptococcus pneumoniae,
S. typhi — Salmonella typhi,
S. typhimurium — Salmonella typhimurium,
SA — streptavidin,
SARS-CoV-2 — severe acute respiratory syndrome coronavirus 2,
scFv — variable domain of immunoglobulin G heavy and light chains,
SERRS — surface-enhanced resonance Raman scattering,
SERS — surface-enhanced Raman scattering,
TBT — 4,4'-thiobisbenzenethiol,
TCID50 — tissue culture 50% infectious dose,
TGA — thioglycolic acid,
TxR — Texas red,
V. vulnificus — Vibrio vulnificus,
VB — valence band,
VhH — variable domain of heavy chain of camelid antibody,
VLP — virus-like particle,
VP — virus particle,
WGA — wheat germ agglutinin,
WNV — West Nile virus,
WST-8 — water-soluble tetrazolium 8,
ХТТ — 2,3-bis(2-methoxy-4-nitro-5-sulfophenyl)-2H-tetrazolium-5-carboxanilide).
References