Keywords
Abstract
Since its initial isolation, graphene has continued to attract sustained interest from the scientific community due to its unique combination of physical and chemical properties. A key factor hindering the development of research and practical applications of graphene is the difficulty of graphene production in practically significant quantities. Currently, the most accessible and widely used method for obtaining graphene is the chemical oxidation – reduction approach. This method involves the preliminary oxidation of natural graphite to form monolayer sheets of graphene oxide, which are then subjected to reduction. A broad range of reduction techniques have been proposed for graphene oxide, among which electrochemical reduction occupies a leading position. The uniqueness of this review lies in providing, in a single work, the most comprehensive coverage of all aspects necessary for thorough study and practical implementation of the electrochemical reduction of graphene oxide. In addition, this review systematizes and compares a substantial body of experimental data and analyzes possible reasons for discrepancies in results obtained under seemingly identical conditions.
The bibliography includes 448 references.
1. Introduction
The aspiration of humanity for perfection in various spheres of material and intellectual existence is reflected in the search for structurally ordered systems. And such systems are typically a source of unique physicochemical properties. From the standpoint of materials science, one of the most significant discoveries of recent decades is graphene, a two-dimensional allotrope of carbon, which is a monoatomic layer with a hexagonal crystal lattice.[1]
The International Union of Pure and Applied Chemistry (IUPAC) defines graphene as ‘a single carbon layer of the graphite structure, describing its nature by analogy to a polycyclic aromatic hydrocarbon of quasi-infinite size’.[2] Within this definition, graphene appears to be a somewhat idealized structure, since the dimensions of a real sheet are always finite, and the structure of its edges inevitably differs from that of the main surface. Moreover, the smaller the lateral* size of the sheet, the greater the influence of edge regions on the material properties. As the lateral size increases, the behaviour of the material is increasingly determined not by the edges but by its basal** plane. Accordingly, structures in which the influence of edge atoms on physical properties is negligible and whose properties are essentially independent of sheet size can be considered quasi-infinite and termed graphene.
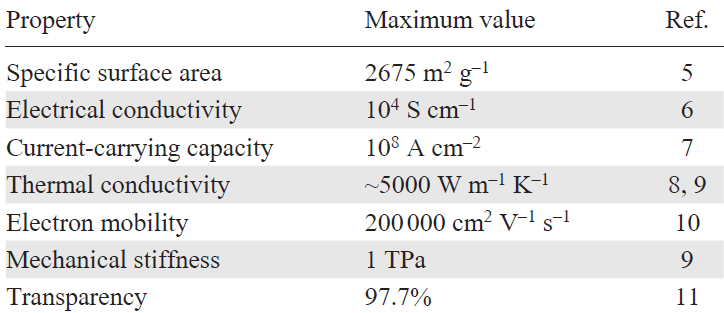
In the structure of graphene, each carbon atom is in an sp2-hybridization state, forming covalent bonds with three neighbouring atoms, which results in a planar honeycomb lattice with an interatomic distance of ~ 0.142 nm.[3] This configuration provides a unique combination of properties: ultimate mechanical strength, record electrical and thermal conductivity, optical transparency in the visible range, and also quantum effects that manifest themselves at room temperature.[4] An additional structural advantage of graphene is its high specific surface area.[5] Some characteristics of graphene are presented in Table 1[6-11].
The above-mentioned set of properties determines the prospects for the use of graphene and its composites in various fields (Fig. 1):[12-16] (1) in electronics and optoelectronics;[17-19] (2) in energy production and energy storage systems;[20-28] (3) in sensing and biomedicine;[29-34] (4) in catalysis, including electrocatalysis and photocatalysis;[35-38] (5) in the development of anticorrosion coatings;[39-42] (6) in hydrogen production and storage processes;[43-46] (7) in substance separation;[47-50] and (8) in water purification and desalination.[51][52]
![[{"id":"y8ysrYjJUs","type":"paragraph","data":{"text":"Application fields of graphene. EMI is electromagnetic interference."}}]](/storage/images/resized/6b7baQeDLh7WLFVzTBEXzSVobFvlkE2irwwdzzor_xl.webp)
The ideal crystalline structure of graphene is naturally formed within graphite, a widespread layered allotrope of carbon. However, despite the widespread availability of the raw mineral, the technological extraction of monoatomic carbon layers remains an extremely challenging task, which accounts for the high cost and limited industrial application of graphene. The theoretical substantiation of the possibility of the existence of a two-dimensional carbon lattice and the prediction of its properties were first presented in 1947 by P.R.Wallace[53] within the framework of the band theory of graphite. Experimental verification of these predictions was achieved only in 2004,[1] when the mechanical exfoliation of monolayers was implemented. The half-century gap between the theoretical description and the practical production of the material is attributable to fundamental difficulties in the separation of graphite layers, associated with the combined action of van der Waals forces and stacking interactions that stabilize the packing of hexagonal layers in the crystal structure. The theoretical value of this interlayer cohesion energy is about 43 meV per atom.[54]
The successful discovery recognized by the Nobel Prize in Physics in 2010[55][56] was made possible, in part, by a breakthrough in the development of physicochemical methods for nanoscale characterization. The refinement of analytical techniques has not only allowed the identification of graphene monolayers but also enabled a detailed study of their unique electronic, mechanical, and optical properties, thereby confirming the material status as a revolutionary two-dimensional carbon allotrope.
Despite its historical significance, the method of mechanical exfoliation of graphene monolayers using adhesive tape, proposed by A.K.Geim[55] and K.S.Novoselov,[56] retains the status of a purely laboratory protocol suitable for fundamental research. This approach, characterized by low reproducibility and labour intensiveness, has no potential for scalable industrial production. Nevertheless, the unique properties of graphene have stimulated intensive research into the development of alternative synthesis methods capable of producing graphene in industrially relevant quantities. Currently, in addition to mechanical exfoliation, the following methods are used to obtain graphene (Fig. 2):[9] epitaxial growth, that is, the production of graphene films on a substrate surface (e.g., SiC);[57] chemical vapour deposition (CVD), that is, the synthesis of graphene monolayers from gaseous precursors on metal substrates;[58] longitudinal ‘unzipping’ of carbon nanotubes (CNTs), that is, the production of graphene nanoribbons by longitudinally opening CNTs;[59] electrochemical (EC) exfoliation of graphite, that is, the delamination of graphite under the action of an electric current in an electrolyte solution;[60] and chemical oxidation – reduction, that is, the exfoliation of graphite by chemical oxidants to produce graphene oxide (GO)[61] or graphene fluoride[62] followed by the reduction of these products. These approaches have their own advantages and disadvantages in terms of controllability, product defectiveness, and production scalability.[63]
![[{"id":"FmgIG5gFwf","type":"paragraph","data":{"text":"Most common methods for obtaining graphene and ways of reducing graphene oxide"}}]](/storage/images/resized/IbcbGcW06fVv9tEps890pHGQy4XdRiasIHBTkmJP_xl.webp)
The strategy of chemical oxidation followed by reduction has become established as the primary approach for the production of large volumes of graphene-like materials at present. Despite the presence of defects in their structure, these materials are characterized by high processability and are widely used for the fabrication of various carbon materials.[9] This strategy, accordingly, consists of two main stages.
In the first stage, natural graphite is treated with strong oxidants.[64] Oxidant molecules intercalate into the interlayer space, leading to the covalent functionalization of the carbon layers with oxygen-containing functional groups (OFGs): epoxy, hydroxyl, carbonyl, and carboxyl groups. The resulting electrostatic repulsion between the functionalized layers increases the interlayer spacing, ultimately causing their complete separation. As a result, GO is formed as the product of the first stage; it differs significantly from graphene in both chemical and physical properties because of the high concentration of OFGs.
Owing to its hydrophilicity, tunable bandgap (ranging from 0.02 to 4.9 eV),[65][66] and high chemical reactivity, imparted by the presence of OFGs in the two-dimensional carbon matrix, GO has attracted considerable attention for technological applications.[67][68] Thus, compared with graphene, GO is free from such limitations as high hydrophobicity, chemical inertness, and poor dispersibility in water. At the same time, it has its own drawbacks, in particular, low electrical conductivity and an amorphous structure.[69]
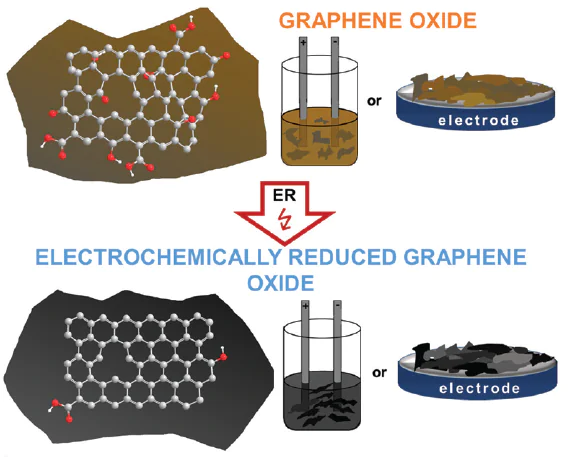
To obtain graphene-like structures, GO is subjected to reduction, during which OFGs are removed and the sp2-hybridized carbon lattice is partially restored. This results in an increase in the electrical conductivity and mechanical strength of the material. The product of this stage is often referred to as graphene; however, this designation is a simplification, since the resulting material has a number of considerable structural differences that are inconsistent with the definition of graphene proposed by IUPAC. In particular, the reduction product of GO often consists of several layers (typically from two to six), contains a large number of sp3-hybridized carbon defects, adatoms, and pores, as well as residual OFGs. Therefore, it is more correct to use the term reduced graphene oxide (RGO). Both GO and RGO belong to the class of chemically modified graphenes.[70]
Graphene oxide is reduced using thermal,[71] chemical,[72][73] photochemical,[74][75] microwave,[76][77] hydrothermal,[78] and EC[79] treatments, as well as ion irradiation.[80] The choice of the reduction method is important because it determines the oxygen content, the nature of residual OFGs, the structure and defectiveness of the material, and consequently the properties of the final RGO.[81-88]
The properties of RGO occupy an intermediate position between those of GO and graphene,[89-91] with a high degree of reduction making it possible to approach the characteristics of graphene.[92] This is precisely why the reduction of GO is often carried out under harsh conditions using toxic reducing agents (hydrazine, sodium borohydride, hydroiodic acid, etc.),[72] heating in an inert atmosphere or vacuum at high temperatures (from 1000 to 2400°C),[93] intense light sources (UV irradiation[94] or powerful lasers[95]), and plasma treatment.[96]
Electrochemical reduction is among the methods widely used to reduce GO. This approach has a number of advantages over the equally common chemical and thermal approaches. Unlike chemical reduction, the EC process eliminates the use of toxic and hazardous reagents that can contaminate the final product and pose a threat to human health and the environment.[97] In chemical reduction, in addition to physical adsorption of components of the reaction mixture, their chemical reactions with the material often occur, leading to the incorporation of heteroatoms into the structure of chemically reduced graphene oxide (CRGO). A striking example of such covalent modification is N-functionalization, which occurs when hydrazine is used as a reducing agent.[98] Compared with thermal reduction, the EC method does not require heating for the removal of OFGs, which decreases energy consumption.[99] Another important advantage is the possibility of precise control over the degree of reduction of GO by adjusting the parameters of the EC process, such as potential, current, and duration of treatment. It has been noted[64][100-102] that EC reduction makes it possible to obtain a material of high structural quality, approaching graphene in its characteristics. This review is devoted to the EC reduction of GO, which has been actively studied worldwide since 2009.[103-106]
Over the past years, a large body of experimental data has been accumulated; however, issues related to the EC properties of GO and the mechanisms of its reduction remain a subject of debate. This is probably due to the fact that the term ‘graphene oxide’ does not refer to a single compound with a fixed elemental composition and molecular formula, but rather to a set of materials united by a common synthetic method, the oxidation of graphite.
A criterion for classification as GO is a few-layer structure (fewer than 10 layers, as in the case of graphene[107]); materials with a larger number of layers are classified as ‘oxidized graphite,’ which emphasizes their structural and functional differences. The layers in oxidized graphite are held together as a stack by hydrogen bonds between water intercalated during the synthesis and OFGs located on the basal planes of the layers. This structural heterogeneity, together with the variability of composition and degree of oxidation, explains the difficulties in unambiguous interpretation of the EC behaviour of GO. Thus, understanding the mechanisms of GO reduction requires taking into account both the chemical features of OFGs and the morphology of the material.
Over the time that has elapsed since the publication of the first studies on the EC reduction of GO, the number of specialized reviews devoted exclusively to this method remains limited.[79][108] More commonly encountered are review articles with a broad thematic scope in which the EC approach is considered only within the framework of comparison of various methods for GO reduction.[96][109-111]
In the present review, we have systematized and summarized the key information on the EC reduction of GO, the synthesis of electrochemically reduced graphene oxide (ERGO), its applications, as well as the specific features of ERGO analysis by various techniques ranging from the first studies in this field to modern advances. The aim of this work is to provide a comprehensive analysis of the state-of-the-art research in the field of EC reduction of GO. In contrast to existing reviews,[79][108] which do not pay due attention to the diversity of voltammetric characteristics recorded under identical conditions, the present work analyzes possible causes of the observed differences.
* Derived from the Latin word lateralis (‘lateral’), the term denotes the external dimension in the plane of a graphene sheet.
** Basal planes are understood as the extensive planar surfaces of carbon sheets consisting of a hexagonal lattice of sp2-hybridized carbon atoms.
2. Features of the structure and chemical composition of graphene oxide
Before proceeding to analysis of the EC aspects, it is necessary to briefly characterize the chemical structure and main properties of the compound under study. The need for this discussion is due to the fact that GO is a heterogeneous, non-stoichiometric material, and various concepts of its structure coexist in the literature.
To date, many models describing the GO structure have been proposed. The most well-known and recognized among them are the following models: Hofmann (1934),[112] Ruess (1947),[113] Scholz-Boehm (1969),[114] Mermoux (1989),[115] Nakajima – Matsuo (1994),[116] Lerf – Klinowski (1998),[117] Szabó-Dékány (2006),[118] Rourke-Wilson (2011),[119] Dimiev-Tour (2013),[120] and Liu (2018).[121] The multiplicity of models reflects the dynamics of scientific progress. Nevertheless, a unified model that exhaustively explains all the physicochemical features of GO has not yet been proposed. A detailed analysis of the structural models is presented in the cited sources and in specialized monographs and reviews.[64][122][123] The Lerf – Klinowski model (1998)[117] (Fig. 3) is considered to be the main working model of the GO structure that underlies most modern studies.
![[{"id":"YyEO-7FvjB","type":"paragraph","data":{"text":"Lerf – Klinowski<sup>117</sup> structural model of GO"}}]](/storage/images/resized/QtaRor6zYvZU943IWQ01D4IgbfUPAyVnE6DX0g8p_xl.webp)
Currently, the generally recognized main OFGs in the GO structure are epoxy (C – O – C), hydroxyl (–OH), carbonyl (–C=O), and carboxyl (–COOH) groups.[92][110][124-128] The presence of these groups leads to the formation of quinoid moieties, furan bridges, five-membered lactone groups, and other structures,[129][130] which expand the range of material properties. The use of sulfuric acid in the graphite oxidation process leads to inevitable functionalization of the carbon layers by organosulfate groups (–OSO3H). Numerous studies[131-134] have confirmed that these groups are covalently bonded to the carbon matrix and are not adsorbed impurities. The atomic C/S ratio can reach 15,[134] and the contribution of organosulfate groups to the total amount of OFGs is estimated at approximately 13%.[131][134] At the same time, the presence of three oxygen atoms in the sulfate group significantly decreases the C/O ratio in GO. The type and degree of GO functionalization vary mainly depending on the synthetic procedure.[92]
It is believed that the carboxyl and carbonyl groups on GO nanosheets are predominantly bonded to sp2-hybridized carbon atoms located at the edges of the nanosheets, whereas phenolic hydroxyl and epoxy groups are mainly bonded to sp3-hybridized carbon atoms located in the basal plane.[125][135] The OFGs located in the basal planes and on the edges/defects differ in their chemical reactivity, being characterized as weak and strong OFGs, respectively.[125][135][136] For example, edge groups such as carboxyl groups are noticeably more stable and less reactive. The results of studies based on machine learning[137] demonstrate that the distribution of OFGs is determined by the size of GO flakes. For large particles (> 5 mm), a predominance of epoxy groups is characteristic, whereas the functional group composition in small fractions (< 2 mm) differs significantly.
According to current views, the GO structure is characterized by the absence of strict order: the distribution of OFGs over the surface of the graphene layers is non-uniform. Transmission electron microscopy (TEM) studies have confirmed that during oxidation, extensive regions with an undisturbed crystalline structure of graphene are preserved, coexisting with oxidized amorphous regions.[138][139]
Moreover, the structure of GO is thermodynamically unstable and undergoes changes during storage.[140] This is due to the fact that the graphene structure, unlike GO, is thermodynamically more favourable, which provokes a slow transformation of GO toward a more stable state.[141] During this process, a gradual loss of OFGs occurs, and an increase in temperature substantially accelerates this transformation. This is precisely the basis of the GO thermal reduction method. Experimental data reported by Li et al.[129] demonstrate that storage of GO at room conditions (25°С, 20 – 70% humidity) for 2 years leads to an increase in the C/O ratio from 1.96 to 2.76. To slow down degradation and ensure the stability of the product, the synthesized GO is recommended to be stored in a dark, dry, and cool place.
The composition and number of OFGs in GO critically depend on the method of graphite oxidation. The main methods are divided into two groups: chlorate and permanganate methods (Fig. 4).[142] The chlorate methods include the approaches developed by Brodie (1859),[143] Staudenmaier (1898),[144] and Hofmann (1937).[145] The most well-known permanganate methods are the Hummers (1958)[146] and Tour methods.[147] A comparison of the C/O ratio and the composition of OFGs in GO obtained by different methods demonstrates that the degree of oxidation of the material increases in the series from chlorate to permanganate methods. This trend is confirmed by X-ray photoelectron spectroscopy (XPS) data presented in Table 2.[142] The number of GO synthesis methods is not limited to those listed. For example, even the classical Hummers method is often used with the prefix ‘modified’, indicating changes to the original protocol, such as variation of reactant ratios or temperature. These modifications directly affect the characteristics of the final product.[148]
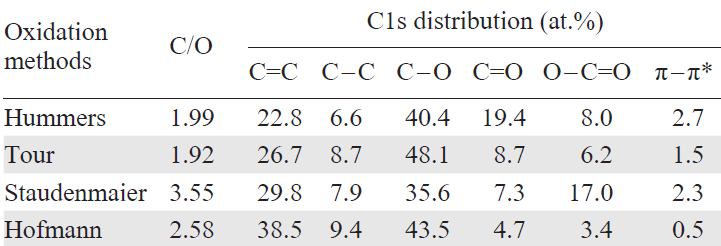
![[{"id":"NF_5m1D0cf","type":"paragraph","data":{"text":"Diagram of the main methods for graphite oxidation to produce graphite oxide. GO is then produced by ultrasonication of graphite oxide."}}]](/storage/images/resized/dmHUiQ5USWqTISkoeqoAcik9lK1S9vhiQgHO1nq8_xl.webp)
The importance of optimizing the time of graphite oxidation was demonstrated by Shao et al.[149] Their studies showed that as a certain degree of oxidation is reached, further increase in the interlayer distance ceases. Consequently, it is necessary to carefully control the degree of oxidation to ensure: (1) efficient exfoliation into monolayers and (2) maximum preservation of the sp2-hybridized structure in GO. The optimal approach is controlled oxidation to a state where the interlayer distance is maximum while the oxidation of the graphene sheet is minimum.
In addition, it should be taken into account that the functionalized GO surface can become a site for the adsorption of secondary products of graphite oxidation. These compounds, held by non-covalent interactions, may remain on the surface even after repeated washing of the product. Such impurities can include low-molecular-weight highly oxidized fragments of graphene sheets[150] or manganese compounds that persist in the product after the synthesis of GO by the Hummers method.[151]
The composition of GO is determined, among other factors, by the starting raw material. In most cases, natural graphite is used, which contains impurities (up to 10 – 20%), such as SiO2, Al2O3, FeO, MgO, CaO, P2O5, and CuO, as well as bound water and clay components.[152] However, in a number of studies, synthetic graphite is used for the synthesis of GO.[153][154] The oxidation processes of natural and synthetic graphite differ, which leads to the production of GO with different structures and compositions. Moreover, natural graphite exists as various structural forms depending on the genesis of the deposit. The main types include vein, large flake, fine flake, and cryptocrystalline graphites,[155] which form a series with a successive decrease in the degree of graphitization (from ~ 98% for vein graphite to ~ 71% for cryptocrystalline graphite). The initial structure of graphite predetermines the level of structural defects, as well as the composition and content of OFGs in the resulting GO, which ultimately significantly affects the properties of RGO. A low degree of graphitization facilitates oxidation, leading to the formation of GO with a larger number of OFGs and defects. Accordingly, to obtain RGO that is as close as possible to graphene in its EC and structural characteristics, it is advisable to use graphite with the highest degree of graphitization, vein graphite, as the raw material.
Special mention should be made of the need for careful application of ultrasonic treatment when working with GO. Numerous studies indicate that ultrasonic exposure causes a pronounced decrease in the lateral size of GO particles[156][157] and increases the density of defects in the form of nanopores.[158][159] Wang et al.[157] demonstrated that after 10 and 30 s of ultrasonication, the average lateral size of GO particles decreases from 15.1 mm to 2.7 and 1.6 mm, respectively.
A striking example of the considerable variability in the composition and structure of GO is the study by Donato et al.,[132] who examined 34 commercial samples. It was found that only four samples met the characteristics declared by the manufacturers. Three samples could not be classified as GO at all due to a low O/C ratio and a small interlayer distance. Many samples did not exhibit typical GO properties, such as the ability to form stable aqueous dispersions and form films. These discrepancies are due not only to differences in the composition and structure, but also by a high degree of contamination. For some samples, even those that formed stable films, an atypically low sheet resistance (less than 100 МΩ sq–1) was recorded, which is also associated with a low degree of oxidation and the presence of impurities.
A significant class of contaminants was found to be metals, the content of which in some samples reached 4 wt.%.[132] The predominant metals were those potentially originating from graphite raw materials, oxidants, or water such as Mn, Na, K, Mg, Ca, and Fe in concentrations reaching thousands of mg kg–1 (ppm). In some samples, Al and Cr (hundreds of mg kg–1) were also detected, as well as Pt, Zn, V, Cu, Co, Se, and Ba (tens of mg kg–1). Although this metal content may not be critical for EC measurements, their presence can affect the electrical, catalytic, and other practical properties of RGO.
Starting from approximately 2014, commercial GO samples have been increasingly used in EC studies. This makes the issue of quality control particularly relevant. Donato et al.[132] emphasizes that the requirements for the purity and reproducibility of commercial samples should be no less stringent than those for materials synthesized under laboratory conditions.
3. Characterization methods for graphene oxide and its reduction products
Graphene oxide and its reduction products (including ERGO) are characterized using a unified set of analytical methods. The main methods include XPS, infrared spectroscopy (IR), powder X-ray diffraction (PXRD), thermogravimetric analysis (TGA), electron and probe microscopy. Raman spectroscopy is also often used. Since most studies on the synthesis of ERGO are aimed at its preparation directly on the electrode surface, in situ analysis of the material without its removal from the electrode becomes of key importance. This requires the use of special modified techniques that allow real-time monitoring of the GO reduction during potential scanning or at specified time intervals. Among these methods, scanning electrochemical cell microscopy-local electrochemical impedance spectroscopy (SECCM-LEIS) and in situ polarization modulation infrared reflection absorption spectroscopy (PM-IRRAS) can be distinguished.[160] The combined use of these methods makes it possible to characterize in situ ERGO deposited on the electrode surface by cyclic voltammetry (CV), electrochemical impedance spectroscopy (EIS), and Raman, IR, and energy-dispersive X-ray spectroscopy (EDX), as well as to obtain sample images using scanning electron microscopy (SEM) directly during the reduction process.
This Section presents the main approaches to the interpretation of experimental data obtained in the study of GO and its reduction products. Particular attention is paid to the application of these methods for the investigation of the EC reduction of GO and the reduction product — ERGO.
3.1. X-ray photoelectron spectroscopy
X-ray photoelectron spectroscopy is a highly informative method for studying the chemical composition of graphene and related materials.[161][162] This method makes it possible to determine elements, their chemical states, and the quantitative ratio between various functional groups from the binding energy of electrons in the inner shells of atoms. This information is critically important for understanding the oxidation and reduction processes in these materials.
For GO and RGO, XPS is the main tool for characterizing the qualitative and quantitative composition of OFGs.[90][163] In the study of oxygenated graphene derivatives, the main analyzed spectra are C1s (280 – 300 eV range) and O1s (530 – 535 eV range). The intensity ratio of the corresponding peaks allows estimation of the degree of oxidation of the material (C/O). Deconvolution of these spectra makes it possible to determine the types and content of OFGs, as well as to monitor their changes during the reduction.[67][89]
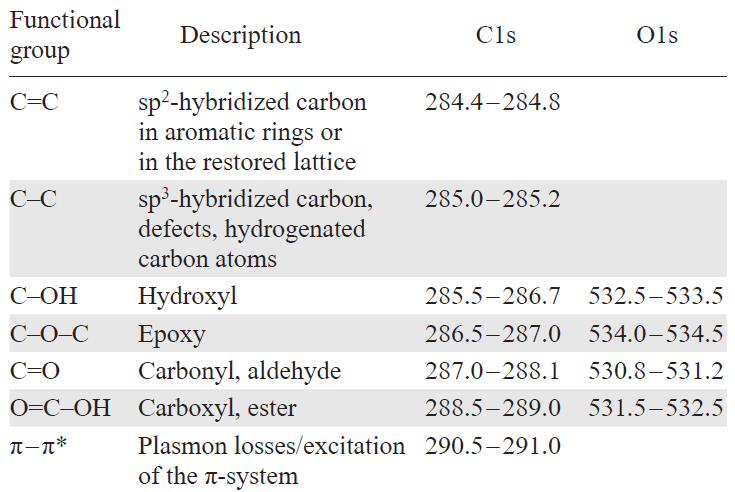
Table 3 presents the average binding energy values for various components of the XPS spectrum, based on literature data,[90][132][161][163-165] and Fig. 5[103][136][166-170] shows, among other things, a typical C1s spectrum with resolved peaks corresponding to different chemical states of carbon (Fig. 5a).[166]
![[{"id":"5xo4FJNfUm","type":"paragraph","data":{"text":"Representative data from comprehensive characterization methods for GO, its reduction products, and graphite: (<i>a</i>) C1s XPS spectra (Copyright Springer Nature);<sup>166</sup> (<i>b</i>) IR spectra (Copyright MDPI);<sup>167</sup> (<i>c</i>) powder XRD patterns [the number in the label indicates the number of CV cycles in the range from 0 to –1.7 V <i>vs.</i> saturated calomel electrode (SCE)] (Copyright Springer Nature);<sup>136</sup> (<i>d</i>) STM image with atomic resolution of ERGO deposited on a single-crystal Au(111) electrode, showing vacancy defects (A) and adatoms (B) (Copyright Elsevier);<sup>168</sup> (<i>e</i>) TGA curves and corresponding derivative TGA curves; RGO samples have been obtained under various conditions (Copyright Springer Nature);<sup>169</sup> (<i>f </i>) Raman spectra (Copyright American Chemical Society);<sup>103</sup> (<i>g</i>) solid-state 13C MAS NMR spectrum for the GO sample (Copyright Springer Nature).<sup>170</sup>"}}]](/storage/images/resized/sL7jyj9fL6C4wDhaFpTnSQIHVlrwt930PldoLPJf_xl.webp)
Analysis of O1s spectra makes it possible to distinguish between carbonyl (~ 530.9 eV), carboxyl (~ 532.0 eV), hydroxyl (~ 533.2 eV), and epoxy (~ 534.4 eV) groups.[165] Changes in the composition of functional groups may be more noticeable in the O1s spectra, whereas in the C1s spectra, they are masked by the dominant contribution of sp2-hybridized carbon. However, the use of O1s spectroscopy is associated with a number of limitations due to the complexity of data interpretation.[164] The main difficulties are related to the overlap of signals from adsorbed species (oxygen, water) with the peaks corresponding to OFGs. For example, according to literature data,[164][171] the peaks of adsorbed hydroxyl groups and water molecules may appear in the region of ~ 530 – 532 eV, which coincides with the binding energy range of carbonyl and carboxyl groups. This markedly complicates qualitative and quantitative analysis.
Because of these difficulties, researchers often pay more attention to the C1s peak, which is deconvoluted into several components corresponding to different chemical states of carbon.[161][163][164][172] For GO, the C1s spectrum typically exhibits peaks corresponding to C–O bonds (epoxy and hydroxyl groups at ~ 286.3 eV), C=O (carbonyl groups at ~ 287.6 eV), and O – C=O (carboxyl groups at ~ 288.8 eV). After successful EC reduction, the intensity of these peaks considerably decreases, while the fraction of the aromatic carbon C=C peak (sp2, ~ 284.6 eV) increases, indicating the restoration of the conductive graphene network.[161][163]
At a high degree of restoration of sp2-domains in the reduction product, a π – π* satellite peak appears in the C1s spectrum (~ 290.7 eV).[132] [164]Its appearance is due to energy loss processes: a photoelectron emitted from the C1s level consumes some of its energy for the excitation of π-electrons from the valence band to the conduction band (π → π* transition). The appearance and growth of the π – π* peak in the spectra of ERGO compared to GO serves as reliable spectroscopic evidence of the successful restoration of the extended conductive π-system.
The integrated application of XPS makes it possible not only to ascertain the fact of GO reduction by the change in C/O ratio, but also to analyze in-depth the mechanism of the process, to identify the defects formed (through the growth of the sp3-component),[90] and to relate the chemical composition to the final functional properties of ERGO, such as electronic and proton conductivity or electrocatalytic activity.[163][173]
The most commonly used parameter describing the degree of GO reduction is the atomic concentration ratio of carbon to oxygen (C/O). The main method for its determination is XPS, which provides quantitative analysis of the surface chemical composition. However, the C/O ratio in ERGO has also been evaluated using other analytical methods: EDX[136] [160][174] and TGA.[175] In addition, the use of activation analysis (nuclear reaction analysis, NRA) for this purpose has been reported.[91]
3.2. IR spectroscopy
IR spectroscopy has long remained one of the most accessible and widespread methods for the analysis of GO and its derivatives, owing to its simplicity, rapidity, and low cost. Today, this method remains a central analytical tool for characterizing the chemical composition and structural transformations of GO and its reduced forms.[176] The method allows direct, non-destructive detection of OFGs.[177]
The main challenge in the interpretation of IR spectra of GO lies in the deconvolution of strongly overlapping absorption bands caused by diverse and spatially heterogeneous OFGs and adsorbed water.[178][179] Classical qualitative comparisons are often insufficient due to the variability introduced by the synthesis method, particle size, and material processing history.[180] Complete and unambiguous interpretation of GO spectra remains a difficult task requiring a comprehensive approach.[177]
Standard interpretation of the IR spectrum of GO involves identification of the following regions:[137][181]
(1) The region of O – H stretching vibrations (3800 – 2500 cm–1): a broad intense band centered at ~ 3355 cm–1 corresponds to O – H stretching vibrations of hydrogen-bonded groups (adsorbed water, hydroxyls, carboxyls). A narrow band at about 3725 cm–1 is usually assigned to free (not hydrogen-bonded) O – H groups, e.g., phenolic ones. Also in this region, bands of C – H stretching vibrations of alkyl groups (~ 2928 and ~ 2850 cm–1) are observed, indicating the presence of unoxidized regions or defects.[181][182]
(2) The fingerprint region (1900 – 800 cm–1) is most informative for the analysis of specific functional groups. An approximate frequency range of stretching and bending vibrations characteristic of these groups is presented in Table 4. It is worth noting only that the band at ~ 1615 cm–1 is a combination of bending vibrations of water molecules and stretching vibrations of aromatic C=C bonds in sp2-domains of the graphene network. Peaks in the region of ~ 1394 cm–1 may be due to O – H bending vibrations or C – O stretching vibrations in tertiary alcohols. In a number of works, this band is also assigned to sulfate groups.[177][183]
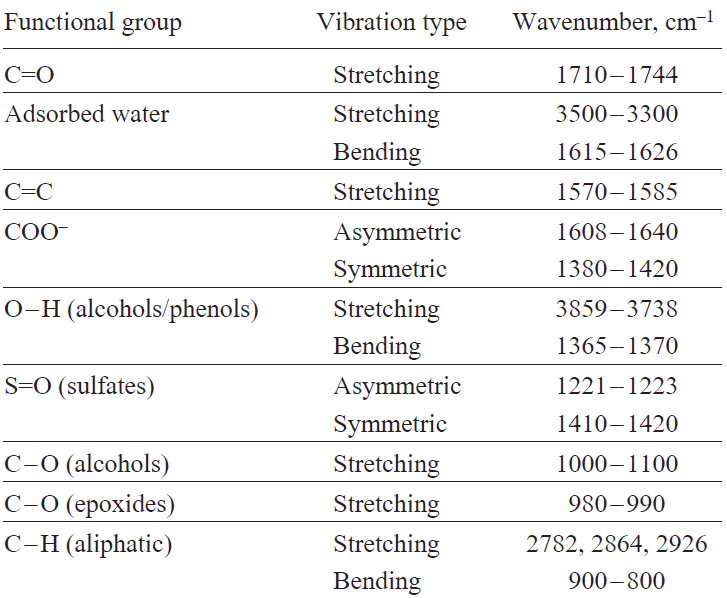
A more detailed and corrected interpretation was proposed in a recent work of the Dimiev’s group,[177] in which the authors succeeded in more unambiguously identifying the bands belonging to the main functional groups of GO: epoxides (~ 985 cm–1), tertiary alcohols (~ 1040 cm–1 and ~ 1368 cm–1), carboxylate groups in salt form (asymmetric ~ 1608 cm–1, symmetric ~ 1380 cm–1), and O–H bending vibrations in carboxyl groups (~ 1281 cm–1). Also, it was pointed out that the C=C stretching band, if active in the IR spectrum, appears in the region of 1570 – 1585 cm–1 and is observed only in the spectra of incompletely oxidized or partially reduced GO, always coexisting with the water band at ~ 1620 cm–1.[177]
The process of EC or any other reduction of GO is aimed at removing OFGs and restoring the conductive sp2-carbon network. IR spectroscopy makes it possible to directly monitor these changes. The reduction is accompanied by a sequential decrease in the intensity of the bands characteristic of OFGs (Fig. 5b).[167] However, complete disappearance of oxygen bands is rare, and residual groups continue to affect the material properties.[83][130]
The order of reduction of OFGs in GO depends on the reduction method. For EC reduction, the following order is often given: epoxy → carbonyl → hydroxyl → carboxyl groups.[69][91][184-186] However, in the literature, there are numerous exceptions showing the diametrically opposite or a different sequence.[187-189]
One of the reasons for such discrepancies, unfortunately, may be the ambiguous interpretation of both IR spectra and XPS data.[180][190] Partial overlap of vibrational modes of different functional groups in the IR spectra, as well as the similarity of binding energies for related groups in XPS, which requires deconvolution of peaks, can lead to subjective assessment in data processing. As a consequence, contradictory assignments of the same spectral features to different functional groups are found in scientific publications.
To overcome the difficulties associated with band overlap and subjective interpretation, chemometric methods and machine learning have been actively introduced in recent years.[137][191] Modern research focuses on establishing structure – spectrum – property correlations, developing reproducible analytical protocols for the standardization of GO, and in situ monitoring of its transformation processes.
3.3. Powder X-ray diffraction
Although the PXRD method is not the primary one in studies of GO reduction, it is important for monitoring the structural changes of the material related to layer ordering.
The presence of a regular layered structure appears as characteristic diffraction peaks, from the position of which the interlayer distance can be determined. Well-ordered graphite exhibits a sharp peak at 2θ = 26.6° [indexed as the (002) reflection], corresponding to an interlayer distance of d = 0.33 nm.[136][192] After oxidation, this peak disappears, and a new peak appears at a lower 2θ angle of 10.8° (d = 0.82 nm),[136] indicating an increase in the interplanar spacing due to the incorporation of OFGs between the graphene layers.
Subsequent reduction leads to a decrease or disappearance of the GO peak. As a rule, a peak appears at 2θ ~ 24.8°, corresponding to an interplanar distance of about d = 0.36 nm.[136] The broad shape of the RGO peak indicates a low degree of crystallinity and a disordered arrangement of graphene layers. Similar peaks are also characteristic of ERGO and have been observed in many works.[103][168][193-198] The 2θ value for the GO and ERGO peaks may vary to some extent, but their position relative to the graphite peak remains predictable. Typical X-ray diffraction patterns of graphite, GO, and ERGO are shown in Fig. 5c.[136]
It should be noted, however, that in a number of studies on the EC reduction of GO,[175][192][199][200] the absence of diffraction peaks has been reported. This may be explained by strong disordering of the graphene layers in the material.[201-203]
3.4. Scanning probe and electron microscopy
Much attention of researchers is paid to the morphology of ERGO formed on the electrode surface, since it is a crucial factor for the electrocatalytic properties of the material. For detailed analysis of the surface structure, roughness, and film thickness, a set of probe [atomic force microscopy (AFM), scanning tunnelling microscopy (STM)][168][204] and electron (SEM, TEM)[192][205] microscopy methods is used. Observations show that during the GO reduction, a regular change in morphology occurs: the removal of OFGs and the restoration of the carbon network are generally accompanied by an increase in roughness and a decrease in coating thickness.[204][206]
Studies have revealed fundamental differences in the ERGO structure depending on the method of its preparation (coating-reducing or electrodeposition).[187][207] Upon reduction of the GO coating on the electrode, a dense ERGO film with parallel-oriented and overlapping layers is formed. In the case of ERGO synthesis by electrodeposition, the structure is qualitatively different: vertically oriented flakes with a high density of exposed edges are formed, which potentially increases the accessible surface area.
One of the first direct pieces of evidence for the restoration of the graphene lattice during EC reduction was obtained by Doğan et al.[168] using STM. Analysis of atomically resolved images confirmed that ERGO mainly consists of a hexagonal sp2 lattice with an average interatomic distance of 0.24 – 0.25 nm, close to the value for graphite (0.246 nm).[152] However, the measured thickness of monolayer fragments (~ 0.8 – 1.0 nm) significantly exceeded the theoretical thickness of graphene (~ 0.34 nm).[152] The authors attributed this discrepancy to the combined influence of residual OFGs, adsorbed water, and the specifics of the tunnelling contact in STM.[168] Atomic defects (vacancies and adatoms) were also observed on the surface. The STM image of the product of EC reduction of GO demonstrates that the EC method effectively restores the conductive graphene-like structure (Fig. 5d ).[168]
3.5. Thermogravimetric analysis
In view of the need for large sample amounts for these studies, TGA is rarely used in the investigation of ERGO, which is typically synthesized on the electrode surface in small quantities. Nevertheless, since this method is recognized as simple and reliable for characterization of industrially produced graphene materials,[208] we considered it necessary to discuss it. It should be noted that the thermal properties of graphene and related materials are determined by a number of parameters, including particle size, number of layers, defect density, and the presence and nature of OFGs.[208]
Fig. 5e shows representative mass loss vs. temperature curves for various graphene materials.[169] In this case, graphite exhibits high thermal stability, which its mass remaining almost unchanged up to 1023 K. Upon further heating up to 1173 K, its mass decreases by only 4%, indicating the high stability of its structure.
A different pattern is observed for GO. Its thermal behavior is characterized by three distinct stages of degradation (Table 5). The first stage, occurring up to 393 K, is accompanied by a mass loss of 19%, which is associated with the removal of adsorbed water and volatile compounds. The second stage, in the range of 433 – 553 K, leads to a more significant mass loss (26%) due to the thermal decomposition of labile OFGs. Upon further heating to 1173 K, an additional mass loss of 19% occurs, caused by the removal of more stable OFGs and the restructuring of the carbon framework.[169]
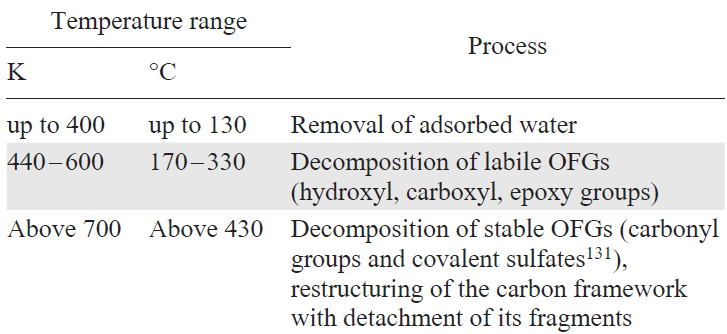
The thermal behaviour of RGO occupies an intermediate position between that of graphite and GO, depending on the degree of the material reduction. In the case shown in Fig. 5e, a relatively small mass loss is observed at temperatures below 600 K, indicating the presence of only a small amount of OFGs in the material. The main degradation of the material occurs at temperatures above 773 K and is associated with extensive restructuring of the defective carbon matrix.
Upon thermal decomposition of GO and RGO, not only evolution of OFGs is observed, but also fragmentation of the carbon framework. This process is accompanied by the release of gaseous carbon oxides (CO and CO2), indicating the simultaneous removal of both oxygen and carbon from the material structure.[129][140][209][210]
TGA was used for quantitative assessment of the degree of GO reduction in studies aimed at scaling up the ERGO synthesis.[175][211] Shang et al.[211] used TGA to confirm the efficiency of the developed setup for scaled-up EC synthesis. The obtained data (mass loss of less than 10% at 600°C) directly indicated a high level of OFG removal in the synthesized ERGO. In another study,[175] TGA demonstrated that mediator-assisted EC reduction of GO allows a considerable degree of OFG removal. The resulting material was characterized by an extremely high C/O ratio of 165 : 1.
3.6. Raman spectroscopy
Raman spectroscopy is among widely used analytical methods for studying the structural features of carbon materials, including graphite, graphene, carbon nanotubes, fullerenes, as well as GO and its reduction products.[212] The method allows quantitative assessment of the degree of structural disorder and defect density in the materials.
In Raman spectra of carbon materials, two characteristic bands are generally analyzed:
— D-band (~ 1350 cm–1), associated with vibrations activated by structural defects such as impurity atoms, functional groups, vacancies, and grain boundaries. This band is due to the breathing mode of phonons of A1g symmetry and is related to vibrations of carbon atoms in the sp3-hybridized state;[213-216]
— G-band (~ 1580 cm–1), corresponding to E2g* optical phonons at the centre of the Brillouin zone, which arise from in-plane vibrations of sp2-hybridized carbon atoms.[217] This band is commonly used for diagnosing the degree of graphitization. As a rule, a lower wavenumber of the G-band indicates a higher concentration of aromatic carbon in the material.
In some cases, the 2D-band (~ 2700 cm–1), which arises from a double-resonance Raman scattering process involving two phonons, is also analyzed. Its parameters (shape, intensity, and position) are highly sensitive to the number of carbon layers, making it possible to determine the thickness of few-layer samples from their Raman spectra.[216-218] Relying on analysis of the 2D-band, Peng et al.[219] showed that EC reduction of the GO coating on an electrode decreased the number of layers from 11 to 7. The authors attributed this to partial chemical exfoliation caused by the removal of OFGs.[211][220][221] This exfoliation may account for the smoother morphology of ERGO compared to pristine GO.[222]
It is generally believed that the main parameter characterizing the degree of structural disorder in carbon materials is the intensity ratio of the D- and G-bands (ID /IG). In the literature, this ratio, expressed either as the ratio of peak heights or peak areas, is used as an indicator of the disordering of graphitic materials.[215][223-226] For low-defect carbon materials, higher ID/IG values indeed correspond to a higher defect density and a smaller graphene domain size.
Based on the analysis of Raman spectral characteristics, Pimenta et al.[224] proposed a relationship for estimating the lateral size (La) of graphite domains, based on the ID/IG:
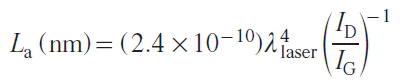
where λlaser is the wavelength of the exciting laser used in the Raman experiment (in eV).
The formation of OFGs during oxidation of graphene layers creates structural defects, leading to significant disorder of the crystal structure. In Raman spectra, this manifests as the appearance of the D-band, which is absent in the spectra of defect-free graphene and graphite (Fig. 5f ).[103] Oxidation also markedly affects the G-band, causing its broadening and a shift toward higher frequencies. In contrast to the D-band, the 2D-band is observed regardless of the degree of defectiveness of the material.
According to a critical review,[227] the application of Raman spectroscopy for assessing the degree of structural disorder in GO and RGO has significant limitations. In contrast to many other carbon materials, GO and RGO are highly defective materials: the average distance between defects for them is less than 3.3 nm. For such materials, the ID /IG ratio is virtually independent of the defect density and remains in a narrow range (~ 1.0 – 1.2), which does not allow distinguishing between samples with strongly differing OFG contents (e.g., with 6% and 65% functionalization) and does not provide a correct estimate of the sp2-domain size. Moreover, this method does not distinguish between the contributions of reversible sp3-defects (OFGs) and irreversible lattice defects (vacancies, holes). Additional, but also significant, limitations are laser-induced photochemical changes of the sample even at low irradiation powers, as well as the heterogeneity of the material, which requires statistical analysis on individual monolayer samples.[227]
* E2g is a doubly degenerate optical vibration of even symmetry in which two carbon atoms in the unit cell vibrate out of phase in the sheet plane
3.7. Solid-state 13С nuclear magnetic resonance
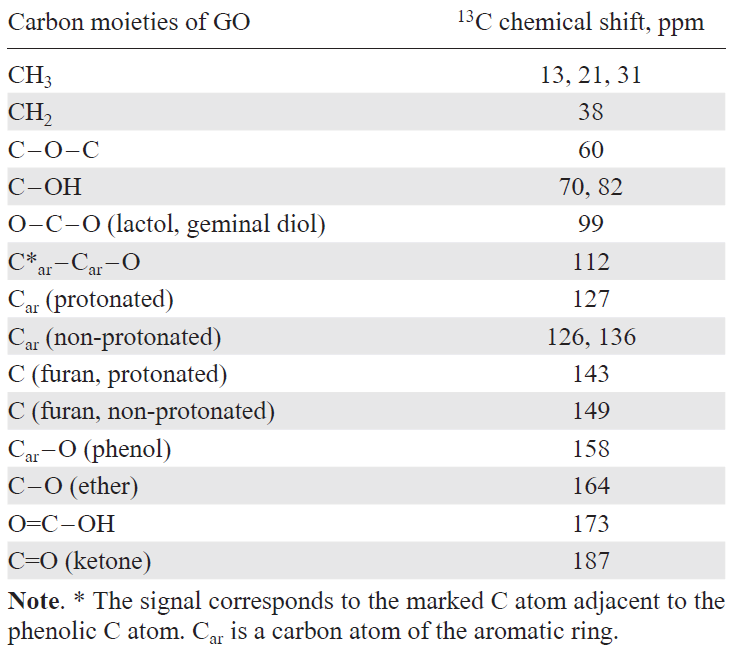
Currently, one of the most reliable and informative methods for GO characterization is solid-state magic angle spinning NMR (MAS NMR) on 13C nuclei.[122] Fig. 5g[170] shows a typical MAS 13C NMR spectrum reflecting the characteristic signals of GO,[170] and Table 6 lists the chemical shifts of various carbon-containing groups found in the structure of GO.[228] The main advantages of the method include: (i) high selectivity: only signals from carbon nuclei are recorded, which eliminates their misinterpretation; (ii) sensitivity to the chemical environment: the pronounced influence of the local structure on the chemical shift allows reliable identification of OFGs; (iii) quantitative analysis: the method provides the possibility to estimate the content of various functional groups in the sample.
However, the widespread use of the method is hindered by its high cost and the considerable duration of the experiment, associated with the need for acquisition of a weak signal, which often forces researchers to use alternative analytical methods. In addition, obtaining interpretable spectra is impossible in the presence of even trace amounts of paramagnetic or ferromagnetic impurities in the sample.[229] As noted earlier, many commercial GO samples contain up to 4 wt.% metal impurities (e.g., Fe, Mn),[132] which hinders NMR analysi. Nevertheless, in the absence of interfering impurities and with appropriate instrumentation, solid-state 13C MAS NMR remains a valuable and reference method for determining the composition and structure of GO, RGO, and their composites.[228][230][231]
3.8. Electron paramagnetic resonance
Defects in the structure of GO and RGO, such as edges, vacancies, and OFGs, serve as sources of unpaired electrons and impart paramagnetic properties to the material. Therefore, EPR is effective for studying the electronic structure of such materials. The EPR spectrum of GO is typically a narrow signal with a width of about 0.30 mT and a g-factor close to that of a free electron (~ 2.00).[232-234] The method provides unique information on the nature and dynamics of paramagnetic centres.
The EPR signal of GO is mainly due to carbon-centred radicals (C•), rather than to residual reactive oxygen species (•OH and •O2–).[232] In highly purified samples, slowly relaxing paramagnetic centres have been identified, which are associated with isolated non-functionalized carbon atoms surrounded by highly oxidized regions.[235][236] Their presence indicates a high degree of structural heterogeneity of the material.
For in-depth studies of redox processes, the in situ EC-EPR method is used. For example,[237] potential scanning demonstrated that two types of spins coexist in GO. Localized spins corresponding to radicals on functional groups (e.g., semiquinones) appear as narrow signals the intensity of which reversibly increases upon shifting the potential to the anodic region. This is due to the oxidation of hydroquinone groups to semiquinone radicals. The second type, delocalized spins of π-electrons in preserved aromatic domains, gives a broad potential-independent signal. Interestingly, in an alkaline medium, the increase in the narrow signal and the g-factor value are more pronounced, indicating greater stability of oxygen-centred radical species at high pH.
The EPR method was also used to study the mechanism of EC reduction of GO.[128] Observations show that during cathodic reduction (–1.1 V vs. Ag/AgCl for 50 min), the EPR signal disappears, which is associated with the addition of electrons to paramagnetic centres. The subsequent anodic oxidation (2.5 V vs. Ag/AgCl for 50 min) can lead to partial recovery of the signal, although its shape sometimes changes, possibly due to structural changes and the skin effect.[238]
An important diagnostic feature is the presence in the spectra of high-purity GO of weak satellite lines with a splitting of about 0.96 mT. These lines arise from the hyperfine interaction of the unpaired electron with nearby protons and serve as an indicator of material purity, since paramagnetic impurities (Mn2+, Fe3+) broaden the signal and mask this fine structure.[235]
3.9. UV-visible spectroscopy
UV-visible spectroscopy is often used to study the EC reduction of GO. Visually, the reduction can be assessed by the colour change of the GO film or suspension from brown to black. Depending on the thickness and degree of reduction, the ERGO film on the electrode may acquire a metallic blue-black or dark blue tint, and in the case of very thin films, interference colours may be observed.[200][239] This colour change is accompanied by an increase in optical absorption throughout the UV-visible range, which is especially pronounced at short wavelengths (~ 300 nm).[240] The dependence of the absorbance at 300 nm on the applied potential (voltabsorptogram) showed a clear correlation with CV, confirming the irreversible nature of the reduction of the studied GO sample on the electrode surface. This optical method allows unambiguous identification of the GO reduction process even in the presence of other EC active components.[240]
The spectrum of pristine GO is typically characterized by an absorption peak at 230 – 235 nm, corresponding to the π – π* transition.[193][241][242] Devadas et al.[242] also detected a shoulder at ~ 295 nm, which was attributed to the n – π* transition. During EC reduction, the observed peak undergoes a red shift to 265 – 290 nm, indicating effective deoxygenation of the material and partial restoration of the π-conjugated system of the graphene structure.[193][241][242]
In addition to all the methods listed above, techniques analyzing the electrophysical properties of the material, which are directly related to the restoration of the conductive sp2-carbon network, are widely used to assess the degree of GO reduction. These methods include: measurement of bulk or sheet resistance;[243] EIS,[160] which allows evaluation of the charge-transfer resistance at the electrode/electrolyte interface; CV;[220] evaluation of specific capacitance;[244] and others.
Mention should also be made of the gravimetric method, a fairly simple technique suitable for confirming the reduction of GO film coated on an electrode. The reduction of GO is accompanied by the loss of OFGs, which leads to a decrease in the mass of the material. For example, after potentiostatic reduction of a solid GO film at a potential of E = –1.1 V (vs. Ag/AgCl) for 4.5 h, a mass loss of 29.3% (from 4.1 to 2.9 mg) was recorded.[219]
The presented review covers only the basic principles of the application of modern analytical methods for the study of GO and its reduction products. These approaches make it possible to effectively control the composition, structure, and functional properties of the material. A detailed description of the application of these methods for the characterization of carbon nanomaterials is presented in monographs (see, e.g., Ref. [229]) and reviews (see, e.g., Ref. [227]).
* * *
In summary, and proceeding directly to the electrochemistry of GO, it can be concluded that the variability of the physicochemical properties of GO discussed in the literature is most likely predetermined by a combination of factors. The main ones are methodological limitations of analysis, the ambiguity of composition, which depends on the origin of the raw material and the synthesis method, and the possible gradual degradation of the material upon storage. Consideration of these and potentially other factors is a primary condition for the correct interpretation of experimental results related to GO.
4. Electrochemistry of graphene oxide
4.1. Electrochemical characterization of graphene oxide
Due to the presence of various EC active OFGs, GO occupies an important place in modern materials electrochemistry. EC methods are used both for the characterization of GO and for the targeted synthesis of ERGO. In the former case, analysis of CV-curves makes it possible to correlate the number of electrons consumed in the reduction with the OFG content.[190] In the latter case, the same methods provide selective reduction of groups to obtain ERGO with desired properties. Thus, quantitative analysis of voltammetric data allowed the estimation of the surface concentration of reducible OFGs. For example, values of about 5 and 4.3 OFGs per nm2 have been reported;[190][222] this characterizes precisely the EC active fraction of the functional groups of GO.
Apparently, a study by Kotov et al.[100] published in 1996 was one of the first works on the EC reduction of a graphite oxidation product. In that work, graphite oxide obtained by the Staudenmaier method was used. Prior to the research of the Nobel laureates, the term ‘graphene’ was rarely used, so the authors used precisely the term ‘graphite oxide’ rather than ‘graphene oxide’. In addition, the authors showed that the oxidized material they obtained was not a monolayer, but consisted of about 2 – 3 carbon layers. Active research on the EC reduction of GO began in 2009, when several research groups published a number of works independently of each other.[103-106]
EC studies of GO and its EC reduction are carried out with samples in two main forms: as films coated on an electrode (Fig. 6)[69] or as a dispersion.[8][108][168][174] [185][199][204][211][245-255] The coating-reducing method is chosen more often, apparently because it allows controlling and presetting the size and thickness of the resulting ERGO film.[219] It consists of two steps; therefore the term ‘two-step method’ is often used in the literature, while the reduction directly from dispersion is referred to as the ‘one-step method’.[103][185][256] The terms ‘solid-state’ and ‘liquid-state’ methods are also encountered, respectively.[190][257]
![[{"id":"4hChar97gp","type":"paragraph","data":{"text":"Schematic representation of the ERGO preparation by the coating-reducing method.<sup>69</sup> Copyright MDPI."}}]](/storage/images/resized/4ZqnUMEvLwP6geAh9dx4KDvEqzmoFQcjOvjjQwId_xl.webp)
The chosen form of the studied GO sample significantly affects the recorded EC parameters. This was demonstrated by Doğan et al.:[168] for a GO suspension, the number and shape of peaks in the CV curves differed from those for a GO film adsorbed from the same suspension (Fig. 7).
![[{"id":"q0y2TYM3Fc","type":"paragraph","data":{"text":"CV curves of GO recorded on an Au anode: (<i>a</i>) direct reduction from suspension; (<i>b</i>) reduction of pre-adsorbed GO (adsorption for 2 h from suspension). Potentials are given <i>vs. </i>Ag/AgCl. Conditions: H<sub>2</sub>O/0.1 М KNO<sub>3</sub>, pH 2.0, scan rate υ = 100 mV s<sup>–1</sup>.<sup>168</sup> Copyright Elsevier."}}]](/storage/images/resized/fdYnfmRgmDvVoWHIDappUWaxpDxHUihnd0xVYkLx_xl.webp)
GO is well dispersed in polar solvents to form colloidal solutions. Due to the large particle size, the diffusion of GO is retarded, which leads to low reduction currents for GO dispersions. According to Yanilkin et al.,[175] the current of GO reduction from dispersion is mainly controlled by diffusion. Nevertheless, there is probably also an adsorption component, which is assumed to be responsible for the change in morphology in the CV (see Fig. 7).
Immobilization of GO on the electrode as a film makes it possible to concentrate the material on the electrode surface, which leads to an enhancement of the EC response on the voltammograms. However, in this case, ambiguity arises. As shown by Wang and Eigler,[157] the EC response of such a system depends on the thickness of the deposited layer; the reasons for this dependence will be discussed in the following Sections.
It should be noted that regardless of the form of GO application (film or dispersion), the product of its EC reduction, ERGO, is adsorbed on the surface of the working electrode. The reason for this phenomenon lies in the change in the properties of the material: pristine GO, rich in hydrophilic OFGs, forms stable dispersions in the polar media used. The reduction is accompanied by the removal of OFGs, as a result of which the material becomes more hydrophobic and deposits on the electrode surface. An additional factor promoting adsorption is the reconstruction of graphene domains in ERGO, which enhances cohesion between its layers due to π – π stacking of aromatic rings. In this regard, the GO reduction from dispersions is called ERGO electrodeposition. However, the process is complicated by the fact that pristine, unreduced GO may be incorporated into the formed layer, which decreases the overall degree of material reduction. To solve this problem, the electrode with the partially reduced deposited layer is additionally subjected to EC post-reduction in a supporting electrolyte solution (without GO).[255]
EC studies are mainly performed using a glassy carbon (GC) working electrode.[104][128][142][185][192][195][223] In addition, for studying the EC properties of GO or as substrates for ERGO deposition, both conductive materials and dielectrics have been used: graphite,[103][258] carbon,[240]carbon fibre,[252] quartz,[104] platinum,[174][259-261] steel,[88][262][263] silicon,[69][220][222][239][264][265] gold,[106][168][188][219][241][243][246][255][265-268] copper,[136][211][263][269] aluminium,[241][263][270] indium tin oxide (ITO),[136][195][197][247][271-275] fluorine-doped tin oxide (FTO),[276] titanium,[254] biomedical CoCr alloy,[204] nickel foam,[251] nickel copper foam,[248] an ATR prism of ZnSe coated with a gold grid,[277] and a graphene-modified electrode.[278]
The main method for coating the electrode with GO is drop-casting, followed by drying.[160][167][269][279][280] Much less frequently used are such methods as spray coating,[104] layer-by-layer technique,[106] spin-coating,[272][273][276][281] and self-assembly on a modified electrode surface.[105][195][265] The listed methods are well suited for laboratory studies. However, for the fabrication of functional materials and devices (e.g., membranes or sensors based on ERGO), where strong attachment of the layer is required, additional strategies are employed. Strengthening the binding of GO to the electrode surface is justified, since it has been shown that during the reduction of deposited GO layers, partial detachment of the material may occur.[211][220][221]
GO can be integrated onto the electrode surface through physical adsorption or covalent attachment via functional groups.[282] Immobilization of GO using the Nafion polymer is widely applied.[283][284] Also, for good bonding of GO particles to each other and for their adhesion to the substrate, i.e., a platinum electrode, polytetrafluoroethylene was used as a binder.[196] In a number of works, chemical modification of the electrode surface was preliminarily performed to improve adhesion. For example, the GC electrode was modified with 3-aminopropyltriethoxysilane,[105][285-288] 1,6-hexanediamine,[195] or p-aminophenol.[282][289] For modification of Au electrodes, cystamine,[106] 2-mercaptoethylamine,[265][288] and polyallylamine[189] were used. Silicon surface was treated with 3-aminopropyltriethoxysilane,[265] copper with (3-mercaptopropyl)trimethoxysilane,[269] and ITO electrodes with polyethyleneimine.[290]
Although the above-mentioned strategies are successfully used for the EC preparation of graphene films, concerns have been raised[195] regarding the applicability of some modifiers. The criticism was mainly related to aminothiol linkers (e.g., cystamine and mercaptoethylamine). Thiol groups anchored on the gold surface can desorb at sufficiently negative potentials used for GO reduction. This complicates the control of the GO reduction process on the Au electrode. In addition, such systems have a restricted potential window (EC-window) and are unsuitable for electrocatalytic applications in either the more positive or more negative potential regions due to possible cleavage of the Au – S bond.[195]
Studies of the GO electrochemistry and the synthesis of ERGO are mainly carried out in aqueous media. This is possible due to the ability of GO to form stable colloidal dispersions in water over a wide pH range (2.0 – 13.0), except for the high-acidity region (pH ~ 1.0).[245] Stabilization of the dispersion is achieved through the negative surface charge of GO sheets arising from the ionization of carboxyl and phenolic hydroxyl groups, which leads to electrostatic repulsion between particles.[201] However, according to more recent studies, it is assumed that the stability of GO colloids is mainly due to organosulfate groups, which ensure the formation of stable colloids even in relatively acidic media.[134]
Several studies have focused on the electrochemistry of GO in polar aprotic organic solvents, such as propylene carbonate,[267][270][276] acetonitrile,[69][239][267][270][276] DMF,[261][270] THF,[267] and DMSO,[270] in which GO also forms stable dispersions. In aqueous media, phosphate buffer solution (PBS) is most often used as the supporting electrolyte, since the reduction is a proton-dependent process (pH ~ 7 is typically used). In the case of organic solvents, tetraalkylammonium salts are used.
Organic solutions have the advantage of a wider potential window compared to aqueous ones, which allows the use of more negative reduction potentials. It is believed that this promotes more efficient removal of OFGs from the GO surface and restoration of sp2-hybridization of carbon atoms.[239][261] For example, for acetonitrile, the EC-window is –3.0 ... +3.2 V (see Ref. [291]) (here and below, all potentials are given vs. SCE unless otherwise stated), enabling the reduction of GO at much more negative potentials (–2.7 V).[239]
Wide potential windows are also characteristic of ionic liquids, which makes it possible to reduce GO at more cathodic potentials without the risk of side reactions, such as hydrogen evolution, typical of aqueous media. Reduction of GO was carried out, for example, in 1-butyl-3-methylimidazolium tetrafluoroborate[292] or hexafluorophosphate.[200] There are also examples of EC reduction of GO in deep eutectic solvents, for example, in the acetamide – urea – ammonium nitrate ternary system.[293]
4.2. Electrochemical parameters of graphene oxide
At the beginning of this Section, we would like to be emphasize once again that GO belongs to non-stoichiometric compounds (berthollides),[294][295] which can vary in composition. This variability leads to the fact that GO samples from different studies often differ in chemical composition and structure, which, in turn, may be the cause of a significant scatter of EC parameters even under similar conditions.
Indeed, a significant scatter of EC parameters of GO is observed in the literature, both in the number of peaks in the voltammograms and in their potentials (Table 7)[296-311].
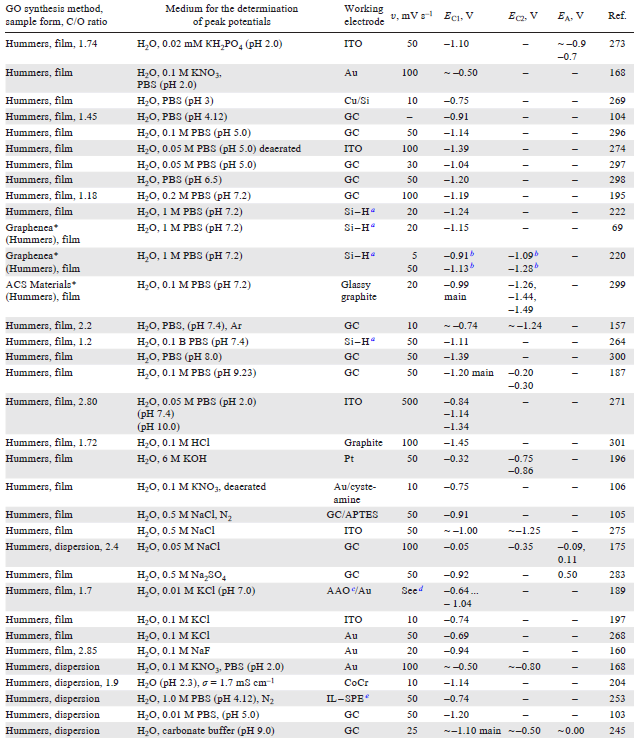
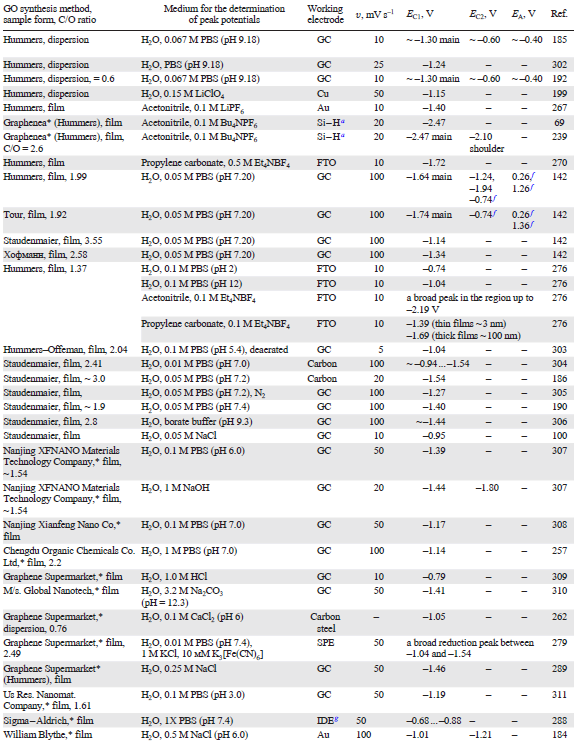
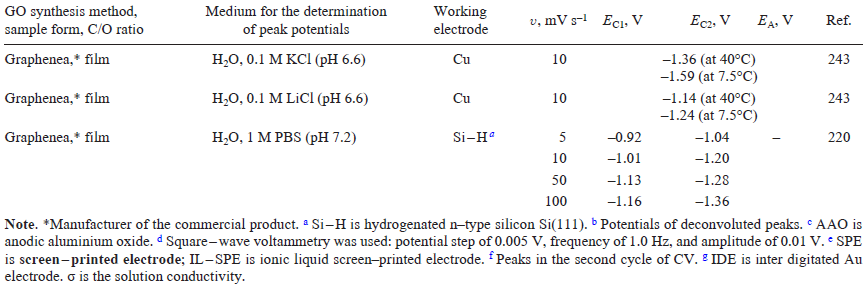
Most often, a single reduction peak is observed, although in some works, the number of peaks is up to four,[220][299] and in some cases, the reduction of GO appears as a gradual increase in the current without a distinct maximum.[312] The onset potential of reduction in aqueous media lies, on average, in the range of –0.6 to –0.9 V,[79][284] while the peak potential Emax is predominantly between –0.8 and –1.2 V.[103][186][200][222][240][280][310] In organic solvents (propylene carbonate, acetonitrile), the reduction is shifted to a substantially more negative region: down to –1.72 V[270][276] and to –2.47 V, respectively.[239] Comparing the EC properties of GO in organic and aqueous media, the authors conclude that the difference between the reduction potentials indicates greater thermodynamic stability of OFGs in organic media.[239][270] It is worth noting that in organic solvents such as THF and propylene carbonate, in contrast to acetonitrile, the reduction of GO appears not as a distinct peak, but as a broad region with increased background current.[267] The broad shape of the GO peaks is due to the diversity of functional groups, each being reduced at its own potential value. In these solvents, the environment of these groups apparently causes an even greater spread of reduction potentials, which leads to peak broadening.
Although the reduction of GO is most often irreversible, in a number of studies, reverse oxidation peaks are recorded at potentials up to +1.3 V.[90][142][175][185][245][273][283] Also, a pair of peaks in close cathodic and anodic regions (between –0.5 and +0.5 V) are observed both for pristine GO and for partially reduced material.[91][103][185][283][313][314] The dynamics of the amplitude of these peaks varies with increasing reduction time: in some works, a decrease was observed,[103] while in others, an increase followed by stabilization took place,[283] which in both cases can serve as an indicator of completion of the process. It is assumed that these peaks correspond to pseudocapacitive redox processes of quinone/hydroquinone pairs, which is consistent with the observed potentials.[313]
The morphology of GO voltammograms is influenced by several key parameters, and, first of all, by the chemical and structural features of the material itself, which are determined by the synthesis method. The use of different oxidants (chlorates or permanganates) determines not only the degree of oxidation, but also the composition and localization of OFGs. Studies by the group of M. Pumera[142][315] clearly demonstrate this difference. The obtained materials differ not only in the reduction potential [more oxidized material is reduced at more cathodic potentials (Fig. 8)],[315] but also in the overall morphology of the voltammograms (Fig. 9).[142] The materials synthesized by chlorate methods (Staudenmaier and Hofmann) show a simple and irreversible pattern: in the first cathodic scan, a broad reduction peak of OFGs is observed in the range from –0.74 to –1.34 V, which completely disappears in the subsequent cycles. In contrast, GO samples obtained by permanganate methods (Hummers and Tour) exhibit complex electrochemistry with reverse stages. After initial ‘activation’ by deep reduction (about –1.6 V), reverse peaks appear in the voltammogram: anodic peaks at +0.26 and +1.26 V and a cathodic peak at –0.74 V. These peaks, which persist for several cycles and gradually decay, are attributed to a quasi-reversible redox pair. This behaviour indicates that permanganate-based materials contain specific, EC active OFGs, probably of quinone type, capable of reversible transformations. This is confirmed by the pH dependence of peak potentials, characteristic of processes involving protons.
![[{"id":"yKEuYZvfRR","type":"paragraph","data":{"text":"CV curves of GO samples synthesized by various graphite oxidation methods: Staudenmaier (ST), Hofmann (HO), Hummers (HU), and Tour (TO). The C/O ratios for the samples are 1.17, 1.15, 0.84, and 0.74 respectively. Conditions: H<sub>2</sub>O/ 0.05 М PBS, pH 7.2, υ = 100 mV <sup>s–1</sup>.<sup>315</sup> Copyright Wiley-VCH."}}]](/storage/images/resized/dVdED8vLmH1MvEIqb5epK5Wm8PuFIPfURaEv9QIp_xl.webp)
![[{"id":"NQaEC9tvQl","type":"paragraph","data":{"text":"CV curves of GO samples obtained by Staudenmaier (ST, <i>a</i>), Hofmann (HO, <i>b</i>), Hummers (HU, <i>c, e</i>), and Tour (TO, <i>d, f </i>) methods. Scan direction: cathodic (<i>a – d</i>) and anodic (<i>e, f</i>). Arrows indicate the direction of the first scan. Potentials are given <i>vs.</i> Ag/AgCl. The initial potential was 0.0 V. Conditions: H<sub>2</sub>O/0.05 М PBS, pH 7.2, υ = 100 mV s<sup>–1</sup>.<sup>142</sup> Copyright Wiley-VCH."}}]](/storage/images/resized/8YVYxcPxyAJj55S5GYPjV4kDFNQmemf1yU6DPRFf_xl.webp)
In addition to the origin of the material, the EC response of GO is significantly influenced by three main parameters: pH of the medium, potential scan rate, and thickness (mass) of the GO coating.[104][222][271][276]
The reduction of GO is a proton-dependent process, which is confirmed by the pronounced effect of electrolyte pH on the EC behaviour of GO.[81][104][195] [276][307] A decrease in H+ concentration (increase in pH) leads to a shift of reduction potentials to the cathodic region. For example, an increase in pH from 4 to 12 causes a shift of the reduction peak from –0.91 to –1.14 V,[104] which is consistent with data from another study,[276] where an increase in pH from 2 to 12 led to a shift of the reduction peak by 0.30 V toward the cathodic side. Reduction also occurs in aprotic and strongly alkaline media (6 M KOH).[196][258] In the latter, reduction can be observed both as distinct peaks[196] and as a gradual increase in current.[258] The role of protons was also demonstrated in organic media: the addition of phthalic acid (in a tenfold molar excess with respect to the number of OFGs) to a GO dispersion in acetonitrile gives rise to an additional reduction peak at –0.69 V alongside the main broad peak at –1.44 V.[90]
The reduction peak potentials of GO substantially depend on the potential scan rate.[220][222] An increase in the scan rate from 5 to 100 mV s–1 induces a cathodic shift of the reduction peaks, which is characteristic of irreversible processes with slow electron transfer kinetics. At the same time, the morphology of the voltammograms changes: two well-separated reduction peaks observed at 5 mV s–1 merge into a single broad unresolved signal at 50 – 100 mV s–1 (at 10 mV s–1, two overlapping peaks are already recorded).[220] Therefore, for a detailed study of the EC reduction mechanism of GO, voltammetric studies should be performed at low scan rates.
When electrochemically characterizing the GO films deposited on the electrode, their thickness (or the mass of GO) should also be taken into account. The thickness of a GO monolayer is approximately 3 nm. With a slight increase in thickness (up to several tens of nanometers), the reduction current increases proportionally to the coating thickness.[100][222][276] However, for a film with a thickness of about 100 nm, a distinct reduction peak is no longer observed; instead, a gradual increase in current is recorded during cycling. An analogous study with controlled GO loading led to identical results.[187] As the loading increased from 0.3 to 3.0 mg, the peak shifted from –1.2 to –1.5 V; at loadings of 6 and 12 mg, the reduction of GO manifests as a smooth rise in current beginning after –1.0 V (Fig. 10).[187] These data confirm that with increasing layer thickness (or loading), the reduction of GO becomes more difficult and shifts toward more negative potentials.
![[{"id":"S8iXw-vKE2","type":"paragraph","data":{"text":"Dependence of CV morphology on the mass of GO loading on the GC electrode (m, μg): (<i>а</i>) 0.6; (<i>b</i>) 3.0; (<i>c</i>) 6.0; (<i>d</i>) 12.0. Conditions: H<sub>2</sub>O/0.1 М PBS, pH 9.23, υ = 50 mV s<sup>–1</sup>.<sup>187</sup> Copyright Elsevier."}}]](/storage/images/resized/r3Z93KS4IOjZV1QgbZz36H8hMtpeabfNci5RWZga_xl.webp)
The kinetics of EC reduction of GO (in a film) upon multiple potential cycling is characterized by high variability, manifested in changes in the shape, amplitude, and number of peaks in the voltammograms. The most common scenario, described in most works (see Refs [69][100][103-106][186][187][220][222][239][257][267][268][275][277][280][297][310]) is the irreversible reduction, in which characteristic peaks are observed only in the first cathodic scan and completely disappear in subsequent cycles. Such behaviour is interpreted as virtually complete reduction of GO during the first voltammogram and is typical of standard conditions in both aqueous (e.g., Ref. [280], in the range of 0.2 to –1.6 V, u = 20 mV s–1) and organic media (–0.2 to –2.7 V, u = 20 mV s–1).[239]However, the number of cycles required for complete disappearance or stabilization of the signal varies over an extremely wide range depending on the layer thickness, the solvent nature, the potential window, and the GO synthesis method. Various studies report stabilization of the voltammogram morphology after 3,[103][195][274][276][298] 5,[289][316] 10,[91][188][273] 15,[317] 20,[311] and even 400 cycles.[196]
In some cases, an alternative dynamics is observed for GO films: an increase in the current in the initial cycles followed by a decrease down to the complete disappearance of the peak.[283] This phenomenon is explained by a cumulative reduction mechanism. In the first stage, the reduction of GO in direct contact with the electrode surface affords a conductive ERGO layer. This expands the EC active area, bringing new GO layers into the process, and causes the current to increase. As the reducible material is gradually exhausted throughout the coated layer, the current decreases, and the peak completely disappears.
The behaviour of GO dispersions upon cycling predictably differs from the typical behaviour of films. Dispersions often exhibit a gradual increase in the amplitude of the reduction peaks over several cycles (e.g., over 10 cycles),[185] which is associated with the processes of adsorption, deposition, and subsequent reduction of GO particles on the electrode surface.
There are also isolated reports in the literature on the influence of the supporting electrolyte cation,[243][318] as well as the nature and morphology of the electrode,[188] on the EC characteristics of GO; however, these data require further confirmation.
4.3. Proposed mechanisms of electrochemical reduction of graphene oxide
The EC reduction of GO, as well as other reduction methods in principle, is a complex cascade process that does not consist in the simple removal of oxygen, but includes selective desorption of certain OFGs, transformation of some OFGs into others, and structural rearrangement of the carbon lattice accompanied by a change in the hybridization of carbon atoms.
According to classical concepts of organic electrochemistry,[319] OFGs should be reduced in a certain sequence: carbonyl and epoxy groups are the first to be to reduced, while hydroxyl and carboxyl groups are the most resistant to reduction. For example, Chua et al.[315] reported approximate reduction potentials: about –1.0 V for aldehyde groups, –1.5 V for epoxy groups, and –2.0 V for carboxyl groups. The results of most studies are consistent with the fact that the predominant reduction sequence corresponds to the relative stability of the groups and appears as epoxy → carbonyl → hydroxyl → carboxyl (see Refs [69][90][91][108][128][136][184-187][190][220][222][255][257][265][266][299][303][310][320]).
However, this sequence can markedly vary depending on the local chemical environment of the groups. Theoretical calculations show that groups located closer to the edges or defects of the graphene sheet are reduced more easily than the same groups located at the center of large oxidized regions.[299] This was confirmed experimentally.[240][277] Two types of GO differing in flake size and OFG distribution were investigated: a sample with a lateral size of ~ 644 nm, rich in epoxy groups in the basal plane and with a high proportion of sp2-hybridized carbon atoms, and a sample with a flake lateral size of ~ 320 nm, with a large number of hydroxyl groups in the basal plane and carboxyl groups at the edges.[240] It was shown that the hydroxyl groups in the second sample are reduced at –0.84 V, whereas the dominant epoxy groups in the first sample are reduced at a more negative potential of –0.99 V. The stability of groups is also decreased if they are in close proximity to each other.[277] At the same time, conductive AFM (C-AFM) studies have shown that reduction generally begins with isolated or weakly bound OFGs and proceeds locally but continuously, with the formation and expansion of conducting islands.[223] Due to the chemical heterogeneity of GO nanosheets, the reduction of even the same type of OFGs often occurs in several stages, which appear as broad peaks in the voltammograms.[69][222][239][277]
The electrolyte composition also exerts a strong influence on the process. A comparison of the reduction in aqueous and organic (acetonitrile) media revealed considerable differences:[69] the content of epoxy groups decreases in both media to approximately the same extent; carbonyl groups are reduced more completely in the organic medium; the content of carboxyl groups decreases in the organic medium but increases in the aqueous medium; the amount of hydroxyl groups increases in both media, but in the aqueous phase, this increase is approximately 8 times higher.
Although many interpretations of the EC reduction of GO are consistent with classical concepts, various researchers report strongly different sequences of OFG removal. The results of studies in which the order of OFG reduction differed from the generally accepted one are summarized in Table 10[321][322].
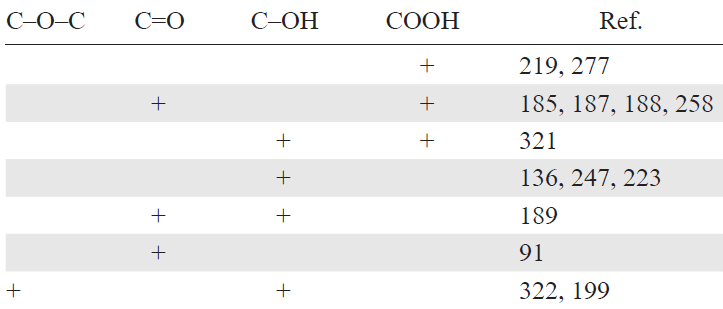
The reduction is often accompanied not only by removal but also by transformation of OFGs; therefore, in a number of works, a decrease in the content of some groups is recorded simultaneously with an increase in others. In many studies, an increase in the content of hydroxyl groups is observed (see Refs [69][128][220][222][256],[323]), which may be associated with the formation of stable intermediate hydroxylated compounds[324] via the reduction of carbonyl groups[219][220][223] or epoxide ring opening.[248] It is hydroxyl groups, rather than carboxyl groups, that are recognized as the most resistant to reduction in some studies.[219][255]
Carbonyl groups can be converted into hydroxyl or ether groups.[160][265] An increase in the signals of the C=O group was also observed, which was attributed to epoxide ring-opening reactions.[166] Epoxy groups are generally reduced to alcohols.[265][276] A number of studies report an increase in the proportion of carboxyl groups at intermediate stages of reduction,[223] predominantly in aqueous media.[69][186][256] An increase in the content of COOH groups was also characteristic under photoirradiation[325] and upon alkaline treatment of GO.[120] A unified interpretation of the mechanism of these transformations has not yet been established.
An increase in the number of C – H bonds is a frequent phenomenon.[69][90][189][256] One explanation for this is keto – enol tautomerism with the formation of intermediate carbonyl and C – H groups.[189] The number of aromatic C=C bonds also increases, while the number of non-aromatic C=C bonds decreases.[160]
The results of studies on the EC reduction of GO in various solvents and over a wide pH range[9][253][258][276] have led to the conclusion that H+ plays a determining role in this process.[88][90] At the initial stage of studying the EC reduction of GO, Zhou et al.[104] proposed the most simple and generalized scheme for this reaction:

Subsequently, epoxy groups began to be considered as the main OFGs undergoing EC reduction, and the corresponding mechanisms were proposed specifically for them. Marrani et al.[69][220][222] and Ni et al.[280] described two possible mechanisms for the reduction of epoxy groups in GO. The first one involves partial single-electron reduction to give a hydroxyl group and a carbon-centred radical in the basal plane of GO (Equation 3). The second variant is complete two-electron reduction, leading to the regeneration of a carbon – carbon double bond and the release of water (Equation 4).
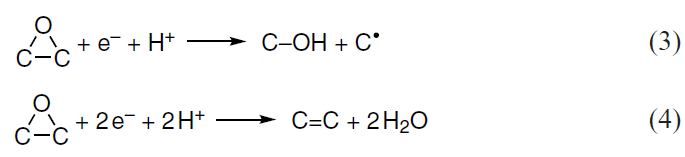
Similar conclusions were drawn by Quezada-Renteria et al.,[90] who suggested that in an acidic medium, the first step is the hydrogenation of predominantly epoxy groups, with the formation of hydroxyl groups, which are removed as water in subsequent cycles.
Alongside these approaches, there is an alternative hypothesis,[90][91][326] according to which epoxy groups are reduced via a four-electron mechanism to form C – H bonds:[326]

Taniguchi et al.[128] proposed yet another possible mechanism (Equation 6, Scheme 1):

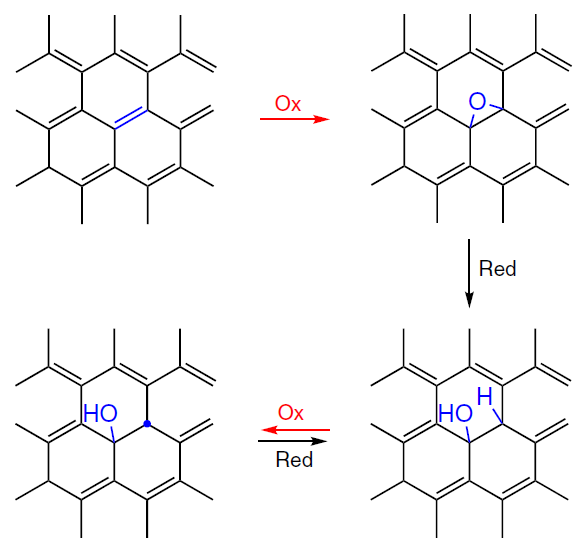
The authors analyzed the products of EC reduction (at –1.14 V) and subsequent oxidation (at +1.46 V). The irreversibility of the reduction of epoxy groups was established. If the reaction proceeded according to Equation 4, the reverse oxidation would regenerate the epoxy groups, as in the primary oxidation of graphene; however, this was not observed. This indicates the absence in ERGO of an extensive system of conjugated double bonds capable of oxidation. According to the proposed mechanism (see Scheme 1), the reduction of an epoxy group leads to the formation of a hydroxyl group and a hydrogenated carbon moiety (COH – CH).[128] This sp3-hybridized structure disrupts the extended conjugation system, which explains why a conductivity close to that of graphene is not achieved in ERGO.
Meanwhile, as shown by Su et al.,[160] upon reverse potential scanning up to +0.2 V, carbonyl groups are regenerated, as confirmed by the appearance of corresponding bands in the IR spectra at 1711 and 1735 cm–1. In addition, the EC activity of ERGO in the anodic potential region is attributed to the formation of a large number of C – H defects during the reduction. Upon subsequent oxidation in aqueous media, this defects can be converted into hydroxyl groups.[69][90][256]
In a recently published study by Wang and Eigler,[157] a new interpretation of the mechanism of EC reduction of GO was proposed, extending the classical model previously presented by Zhou et al.[104] In the study by Zhou et al.[104] the expanding three-phase interface (3PI) model of the Fray–Farthing–Chen (FFC) process[327] was used as a conceptual framework to explain the reduction of non-conductive GO films on insulating substrates. According to this model, the process is initiated at the contact point of the working electrode with GO in the presence of electrolyte; upon application of a cathodic potential, GO is reduced to conductive ERGO, which leads to a shift and radial expansion of the three-phase interface (ERGO/GO/electrolyte). This mechanism enables the fabrication of conductive graphene structures without the need for transfer or lithography.
Building on this fundamental model, Wang and Eigler[157] proposed its further development, taking into account proton conductivity and the anisotropy of GO layers. By means of real-time optical monitoring (video recording through an optical microscope in differential interference contrast mode) of the changes in the contrast of the GO layer deposited on the electrode, they established that the reduction includes three stages (Fig. 11).[157] The main factor determining the reduction kinetics at all stages is the availability of protons to GO. The first stage reflects the reaction at the GO/substrate/electrolyte (GSE) interface, where protons are supplied directly from the electrolyte and electrons are transferred from the GC electrode. The onset of this stage is recorded at a potential of E ≈ –0.60 V. The second stage corresponds to the reduction at the GO/ERGO/electrolyte (GEE) interface, where protons are supplied from the electrolyte through the edge regions of the GO layer, and electrons are conducted through ERGO, which has a higher resistance than the GC electrode. The third stage involves the transfer of electrons and protons at the GO/ERGO interlayer (GEI) interface, where protons are generated by the self-dissociation of adsorbed water in the interlayer space, and electrons are conducted through ERGO. This stage proceeds more slowly and requires a higher potential due to the limited conductivity of ERGO and hindered proton transport. The contribution of the slow stage can be minimized and the efficiency of GO reduction can be increased by forming through-plane proton channels. Their formation is induced by a decrease in the thickness of the GO layer and a diminution in the lateral size of the GO flakes. The main sources of the channels are wrinkles and inter-flake gaps formed during GO deposition, as well as vacancy defects in the GO structure.
![[{"id":"K8vLLSnIz9","type":"paragraph","data":{"text":"(<i>a</i>) Voltammogram of GO reduction. Insets: images of the membrane at different potentials. The coloured areas in the Figure correspond to proton and electron transfer at different phase interfaces. (<i>b</i>) Enlarged fragment of the voltammograms of GO reduction. Membrane states: (<i>c</i>) before the appearance of the first peak in Figs <i>a</i> and <i>b</i> (at –0.60 V), (<i>d</i>) after the appearance of the first peak; at potentials: (<i>e</i>) –1.40 V, (<i>f</i> ) –1.50 V, (<i>g</i>) –1.60 V.<sup>157</sup> Copyright Wiley-VCH. Fig. 11<i>d</i> models the situation occurring in the entire region 1 (CSE), Fig. 11 c corresponds to situation ahead of zone 1. The remaining models are associated with the reduction potential."}}]](/storage/images/resized/Qv3f5U34MiHrXbGIwoVRwepd0bySkT3OW5TrBdO8_xl.webp)
Wang and Eigler[157] noted that the data from previous studies relating the reduction potentials of GO to specific types of OFGs require revision. In their opinion, the key factor affecting the kinetics and potential of GO reduction is not the chemical nature of OFGs, but the availability of protons at the reduction site. The observed shift of the reduction potentials to the negative region was attributed to the hindered proton supply through the GO layer structure rather than to the EC activity of certain groups.
The multistep nature of the GO reduction is also associated with the conformation of its flakes on the electrode surface.[264] It has been suggested that peaks at less cathodic potentials correspond to the reduction of OFGs located on flat regions of GO with good contact to the electrode, whereas the reduction of groups on twisted and wrinkled regions requires more negative potentials due to poorer contact.
The EC reduction of GO proceeds effectively not only in proton-donating media, but also in alkaline aqueous solutions (e.g., 6 M KOH)[258] and in aprotic organic electrolytes. The exact mechanism of reduction in the media in which Brønsted type acids are absent has not been described in detail in the literature and, obviously, it differs from the mechanisms characteristic of acidic aqueous solutions. One possible factor may be the weak H+-donating ability of the solvent itself, for example, in the case of acetonitrile,[69] as well as trace amounts of water. In the absence of protons, the reduction of OFGs apparently proceeds via an anionic elimination mechanism,*[328] which involves electron transfer giving a carbanion intermediate and subsequent elimination of an oxygen-containing moiety.[270]
* Elimination mechanism in which a fragment is removed as an anion
4.4. Synthesis of electrochemically reduced graphene oxide
Before considering the main aspects of this Section, the following terminological conventions should be introduced. Regardless of the degree of GO reduction and the characteristics of the resulting product, the starting material is denoted as GO and the product of its reduction is called ERGO. This differentiation is due to the significant scatter of the reported C/O ratio values, which conventionally characterize the reduction degree of the material. In the analyzed works, the C/O ratio for pristine GO varied in the range of 0.76 – 3.20. At the same time, the reduction products of highly oxidized GO could have a C/O ratio starting from approximately 1.4. Table 11[329-334] summarizes data on the change in the C/O ratio after EC treatment of GO and the conditions of this treatment.
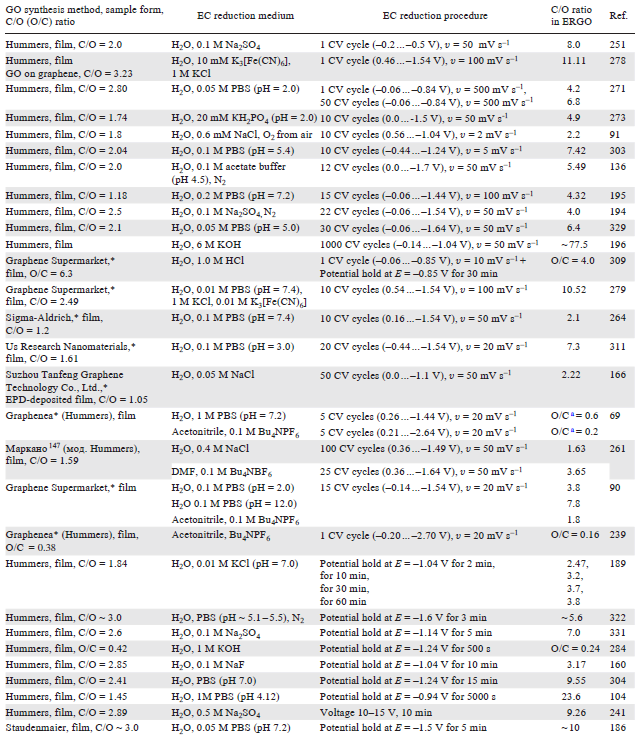
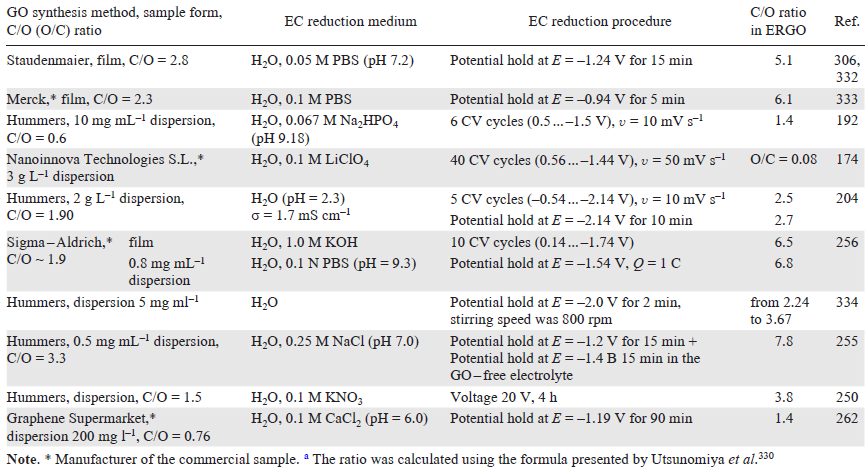
According to literature data, the EC reduction of GO generally consists in a decrease in the oxygen content, an increase in the proportion of sp2-hybridized carbon, and transformation of OFGs, which is accompanied by the formation of small sp2-domains. The removal of some OFGs leads to a decrease in the material mass.[219] It was also noted that in organic solvents, especially in acetonitrile and propylene carbonate, the reduction proceeds more efficiently than in aqueous solutions.[267]
The potential range for the GO reduction is usually divided into four distinct regions. For example, for a 1 M KOH medium (see Ref. 284), the following regions can be distinguished: (1) surface reduction (down to ~ –0.6 V), where the reductionaffects predominantly surface groups and does not lead to significant changes in the material bulk; (2) the initiation of deep reduction (from ~ –0.9 V), at which substantial removal of OFGs and an increase in the proportion of sp2-hybridized carbon are observed; (3) the region of maximum reduction (~ –1.2 V), where the highest degree of deoxygenation and the formation of a well-developed sp2-structure are achieved; and (4) finally, the saturation zone (down to ~ –1.5 V), where further potential shift does not cause noticeable changes in the composition or properties of the material, but may lead to side reactions.
In aqueous media, a major problem of GO reduction on the electrode is the competing hydrogen evolution reaction.[223][335] Often, high negative potentials are applied to intensify the reduction of GO, which inevitably leads to the formation of gas bubbles. Water intercalated between the GO layers is reduced first, and only then reduction of the bulk water in the electrolyte takes place.[136][299][336] This decreases the current efficiency of the reduction and can cause detachment of the ERGO film from the electrode surface, resulting in a low degree of the material reduction. For example, on a platinum electrode with a low hydrogen evolution overpotential, the reaction already begins at potentials around –0.29 V.[261] Hydrogen bubbles physically peel off the forming ERGO layer, leading to incomplete and non-reproducible coating. As a result, the material obtained from an aqueous suspension has a low degree of reduction (C/O ratio ≈ 1.63). On carbon electrodes, hydrogen evolution starts at potentials more negative than –1.5 V (at pH ~ 7).[108][186][222][266][322]
Carrying out EC reduction in an organic solvent, for example, in DMF, avoids competing hydrogen evolution. This provides a number of advantages: (i) the possibility of applying more negative potentials; (ii) the formation of a complete, dense, and reproducible coating; (iii) the production of a more reduced product with a substantially lower oxygen content (C/O ≈ 3.65); (iv) a significant decrease in the electrode modification time (25 cycles versus 100 in water) and an increased probability of obtaining a continuous layer (in DMF, a continuous film is formed in 83% of cases, whereas in water, it is formed in 40% of cases).[261]
Meanwhile, hydrogen evolution can be utilized. For example, to obtain RGO films on various substrates, including polymer ones, preliminary deposition of a protective poly(methyl methacrylate) layer is employed. [241] Simultaneous reduction of the coated GO and subsequent detachment of the film by hydrogen evolution yields a material with a high C/O ratio (up to 9.26), optical transparency of 90% (at 550 nm), and sheet resistance of 6390 ± 447 Ω cm–2.[241] The key element of the method is the formation of a moving reduction front at the metal/GO/electrolyte triple-phaseboundary, where GO reduction and H2 bubble generation occur synchronously, ensuring rapid and uniform detachment of the film without damaging its structure. The function of the protective layer is to impart mechanical rigidity to the detaching film, preventing it from tearing under the action of hydrogen bubbles. For the reduction of GO, contact of the three phases (metal/GO/electrolyte) is necessary. Such a combination is implemented at the edges of the deposited GO film; hence, the reduction of GO starts from there. Under synthesis conditions (voltage of 10 – 15 V), as GO is reduced, H2 bubbles begin to evolve, which leads to detachment of the reduced part of GO and the formation of a new metal/GO/electrolyte interface. Thus, the film detaches gradually, and poly(methyl methacrylate) prevents it from tearing.
Another technique involves potentiostatic reduction of GO at –0.84 V for 100 s, followed by treatment with short pulses of negative potentials (–1.54 V).[246] This allows removal of loose and weakly attached layers through local gas evolution, forming a thin (~ 10 nm) dense transparent and highly conductive ERGO layer that completely covers the electrode surface.
The effect of dissolved oxygen on the EC reduction of GO has been investigated. According to observations of García-Argumánez et al.,[204] the presence of oxygen in the electrolyte slows down the reduction kinetics, increases the structural defectiveness of the formed layer, and leads to a change in the OFG profile by increasing the proportion of C=O groups relative to C – O groups. At the same time, the overall C/O ratio in the films remains almost unchanged regardless of aeration conditions.
For the GO reduction in a standard three-electrode EC cell, various EC approaches can be used, including potentiodynamic methods [CV and linear sweep voltammetry (LSV)], the potentiostatic method (chronoamperometry) (Fig. 12), and occasionally differential pulse voltammetry (DPV).[311] Among these, the main attention of researchers is attracted by CV, since this method provides good control over the thickness of the formed layer on the electrode surface and also provides information on the potentials and the degree of reversibility of the occurring redox processes.[108] An alternative approach, first described by Yanilkin et al.,[175] deserves special mention; it allows efficient scalable synthesis of ERGO in the bulk of the suspension via mediator-assisted EC reduction, without requiring direct contact of GO particles with the electrode surface.
![[{"id":"K9P9ZME3-C","type":"paragraph","data":{"text":"Principal strategies for the EC reduction of GO, the form of pristine GO and the resulting ERGO."}}]](/storage/images/resized/vmxK2MuP8QUS3HOcIWhuCySD3I7q4f8oU9AQlVee_xl.webp)
A comparison of CV and chronoamperometric methods for the reduction of GO in non-aqueous media revealed the advantage of the former approach.[239] Reduction by CV produces higher-quality ERGO, characterized by improved electrical conductivity,* fewer structural defects, and a lower oxygen content. It is noted that gradual potential scanning promotes the selective and complete removal of even the most stable OFGs. At the same time, the instant application of the maximum cathodic potential can lead to uncontrolled and non-uniform reduction.[239] The CV method facilitates uniform electrode coating, whereas the chronoamperometric approach results in the ERGO being formed as islands.[204]
Considerable differences have been noted in the literature between ERGO produced via reduction of GO coated on an electrode and ERGO produced via reduction of GO dispersed in a suspension.[256] It was found that the sample obtained from the suspension had a coarser morphology and a smaller interlayer spacing (0.37 vs. 0.44 nm), as well as a higher C/O ratio (6.8 vs. 6.5). Nevertheless, according to Raman spectroscopy data, the product obtained by the coating-reducing method had a more graphitized structure. The nature of the residual OFGs depended both on the synthesis method and on the CV cathodic potential sweep range (Fig. 13).[256]
![[{"id":"h7WEKnIrYq","type":"paragraph","data":{"text":"Dependence of the C/O ratio (<i>a, b</i>) and the percentage of various OFGs (<i>c, d</i>) on the reduction potential for ERGO films obtained by the coating-reducing (<i>a, c</i>) and electrodeposition (<i>b, d</i>) methods.<sup>256 </sup>Copyright IOP Publishing. ap means ‘as prepared’: pristine GO that has not yet been subjected to EC reduction."}}]](/storage/images/resized/SDoMqwsVZ1skK7dK065dl3e5iICn9CQ34V8ZlWhG_xl.webp)
Zhang et al.[187] and Xu et al.[207] compared the microstructures of ERGO obtained by the coating-reducing method and by electrodeposition (Fig. 14). In the former case, a dense coating with overlapping layers oriented parallel to the electrode surface was formed on the electrode. In the latter case, ERGO formed vertically oriented structures with a large number of exposed edge planes. The electrodeposition ensured more complete removal of OFGs and an increase in the proportion of sp2-hybridized carbon, according to XPS data.
![[{"id":"klBVvKMwmu","type":"paragraph","data":{"text":"SEM images of ERGO samples obtained by electrodeposition (<i>a</i>) and coating-reducing method (<i>b</i>).<sup>207</sup> Copyright Elsevier."}}]](/storage/images/resized/xY2X9fakkuqX6osdUcyWcnPOsRmaevwHyy14lA8H_xl.webp)
The presence of protons in aqueous electrolytes facilitates the removal of OFGs, but simultaneously causes hydrogenation of carbon atoms in graphite domains.[90] These reactions can also occur under alkaline conditions if the applied potential is sufficiently negative (more negative than –1.24 V) and/or is applied for a sufficiently long time to electrolyze water. The C/O ratio in the ERGO samples followed the trend: pH 12 > pH 2 > organic electrolyte,** indicating more efficient removal of OFGs in aqueous electrolytes. However, samples reduced in acidic medium had the lowest sp2/sp3 ratio, confirming the introduction of defects in the form of sp3-hybridized domains due to hydrogenation of highly reactive regions. Meanwhile, materials reduced in organic electrolytes showed a higher electron transfer rate, which is associated with a smaller number of sp3-defects.[69][90] The influence of hydrogenation reactions on graphite domains may be determined by both the OFG nature and location (edge/plane) on the graphene sheets.[90] Raman studies show that the lateral sizes of graphene domains decrease in the series: GO → ERGOaq. → ERGOorg. During the reduction, the total area of graphene domains increases, while the sizes of single domains in both ERGO samples decrease to similar dimensions and become separated by an increased number of defects.[69][337]
The important role of stirring of GO suspension during its EC reduction has been emphasized.[103] Stirring ensures the delivery of GO particles to the electrode surface and promotes the removal of hydrogen bubbles, the formation of which often accompanies this process. The optimal ranges of medium parameters for the EC reduction of GO suspensions (0.5 mg mL–1) were determined: electrical conductivity of the GO/electrolyte mixture of 4 – 25 mS cm–1 and pH of 1.5 – 12.5.[255] At lower conductivity, electrodeposition does not start, while at higher conductivity, the suspension becomes destabilized, leading to particle aggregation. In acidic media, GO reduction strongly competes with the hydrogen evolution reaction. The deposition rate can reach 1 mg h–1 under the following conditions: potential of –1.2 V, pH 7, NaCl (0.25 M), GO (0.5 mg mL–1), and stirring.[255]
The properties of ERGO obtained by CV electrodeposition in aqueous media primarily depend on the potential scan rate, the number of cycles, and the reduction potential window, and, to a lesser extent, on the initial GO dispersion concentration and pH.[247][323] A single cycle at a high scan rate (100 mV s–1) yields the most conductive and electrocatalytically active material, which is confirmed by the best performance in electron transfer reactions (exemplified by the [Fe(CN)6]3–/4– redox pair)[247] and charge accumulation in the electrical double layer.[323]
Increasing the number of cycles or decreasing the scan rate leads to a longer reduction time. Excessive reduction introduces more defects, damages the sp2-structure, and removes a significant portion of OFGs; all these factors collectively degrade the electrocatalytic properties of the material. In some works, 50 mV s–1 (see Ref. 248) or 200 mV s–1 (see Ref. 8) were proposed as optimal scan rates. A higher scan rate ensures the formation of a more porous and open structure of ERGO, which is favourable for the capacitive properties of the material.[8] A symmetric potential window of –1.0 to +1.0 V was proposed as optimal for aqueous media.[323] For this potential window, ERGO with an optimal structure is formed: the highest proportion of sp2-carbon (61.1%), large sp2-domains (ID/IG = 1.41), and a balanced amount of residual epoxy (~ 19%) and hydroxyl (~ 19%) groups, which prevent layer aggregation. Shifting the window boundary to the cathodic (down to –1.5 V) or anodic region (up to 1.6 V) leads to deterioration of the properties of the final material, for example, its capacitive properties.[323]
In non-aqueous media, where the GO reduction potential is not limited by the water discharge process, a decrease in the scan rate promotes more efficient reduction of GO. A similar effect can be achieved by increasing the number of cycles in CV at a fixed scan rate. The reduction of GO in organic solvents occurs at more cathodic potentials than in aqueous media (see Table 7).[69] The total charge consumed in the reduction is higher in an organic medium, indicating more complete reduction involving a larger number of OFGs. The inverse dependence of the integrated charge on the scan rate indicates that the reduction of GO is a slow process controlled by charge transfer kinetics.[338][339] This is accompanied by both a high degree of OFG removal and an increase in the content of C=C bonds.[270] Moreover, it is noted that in alkaline aqueous media or aprotic organic solvents, the most efficient reduction is achieved not at the peak potentials, but at an overpotential of about 1 V relative to these values.[276]
EC reduction of GO is possible not only on the surface of the electrode, but also on ready-made non-conducting materials of various architectures: fibres, films, and porous structures (Fig. 15).[292] In this approach, GO itself acts as the working electrode, and the reduction is initiated through local contact with an external electrode (point-to-plane, line-to-plane, plane-to-plane contacts), which ensures rapid and uniform reduction of the sample. This method is especially effective for fabricating electrically conductive GO composites with sensitive biopolymers (e.g., silk fibroin),[292] since charge transfer occurs inside the polymer matrix without damaging it and without high temperatures or chemical contamination. The resulting material retains mechanical strength and acquires the desired electrical conductivity.
![[{"id":"TxtQGWYcr8","type":"paragraph","data":{"text":"Photographs of ERGO films obtained on various substrates: (<i>a</i>) glass, (<i>b</i>) PET, (<i>c</i>) curved glass, (<i>d</i>) fibre, (<i>e</i>) and sponge. Reduction conditions: Н<sub>2</sub>О/1 М KCl or NH4Cl, Е = –1.24 V.<sup>292</sup> Copyright The Royal Society of Chemistry."}}]](/storage/images/resized/MGhnwhG3zwRms8soNX9ZyV9xht78IW2bgntBCEgJ_xl.webp)
EC reduction of GO can be initiated by a freshly deposited layer of metallic copper. Li and Yang[340] deposited a layer of copper nanocrystals (100 – 150 nm) on a titanium foil by CV from a CuSO4/H2SO4 solution. When the resulting electrode was immersed in a GO suspension, spontaneous partial reduction of GO occurred on the copper surface according to the reaction: GO + Cu → RGO + Cu2+. The subsequent EC reduction at –1.5 V in DMF/0.1 M NaNO₃ removed residual OFGs and increased the electrical conductivity of the material by almost an order of magnitude.[340]
Another method for forming GO coatings on electrodes is electrophoretic deposition (EPD).[197] We have left it for separate discussion to consider in more detail.
Upon dispersion of GO, OFGs dissociate, and depending on the pH and ionic strength of the solution, the surface of the GO sheets acquires a negative charge.[341] The main negative charge carriers are carboxyl and phenolic groups,[254] as well as organosulfate groups.[134] Experimental studies show that the zeta potential of GO dispersion particles varies from –4 to –44 mV as pH increases from 1 to 14.[342] Such zeta potential values provide high electrophoretic mobility of particles in an electric field, which makes EPD an effective method for forming GO films on electrodes.
Anodic EPD of GO is widely used to obtain films for a wide range of applications.[343-345] In this method, an electric field induces the migration of charged GO sheets toward the oppositely charged electrode. The GO sheets are deposited on the anode, forming uniform films of controlled thickness.[346]
It is important to note that the anodic EPD process is accompanied not only by deposition, but also by EC transformations of GO. A number of studies indicate that the formation of a deposit on the anode may be accompanied by EC oxidation with the removal of some OFGs.[343][347-349] The proposed mechanism involves Kolbe-like reactions, in which decarboxylation occurs with the release of CO2.[347][348] Despite the fact that the process occurs at the anode and is oxidative in nature, it may yield partially reduced material, which is also often referred to as ERGO. However, it is important to emphasize that the mechanism and outcome of this EC oxidation at the anode differ significantly from those of the cathodic EC reduction of GO.[104] In particular, the material obtained by anodic deposition is characterized by a large number of defects, for example, vacancies in the carbon lattice.[350]
The anodic EPD technique is often used as an initial step for preliminary deposition of GO onto the electrode surface.[166][269] Although OFGs are partially removed during this process, it is not as efficient as in the subsequent cathodic reduction. Therefore, after forming the GO film on the anode, electrode polarity reversal is often applied, so that the same electrode with the deposited film is used as a cathode for further and more controlled EC reduction of GO to ERGO.
This combined approach formed the basis of a scaled-up process. Shang et al.[211] used a setup with 24 copper electrodes and a 15 L reactor for the synthesis of ERGO. At the first stage (anodic EPD) at a voltage of 30 V for 30 min, GO was completely deposited from solution onto the anode. Then, after polarity reversal, the electrode with the GO film became the cathode, and reduction was carried out at a voltage of 60 V for 180 min. As a result, a part of the material remained on the electrode, and the other part passed into the solution. The obtained products differed: the C/O ratio was about 5.8 for ERGO on the electrode and 4.6 for ERGO in the solution (the initial GO had C/O ≈ 2). A similar principle of alternating processes underlies the pulsed potentiostatic method, in which short pulses of positive (+0.1 V) and negative (–1.2 V) potentials alternately cause electrophoretic deposition of GO and its reduction to ERGO, respectively.[335]
There are other scalable approaches that combine cathodic and anodic processes. For example, Tong et al.[250] developed an EC cell where a graphite cylinder with rods served as the cathode and a platinum plate served as the anode. Vigorous stirring of the GO suspension ensured alternating contact of GO particles with both electrodes, leading to reduction in the bulk of the solution. Electrolysis was carried out at a constant voltage of 20 V in 0.1 M KNO3. The C/O ratio increased sharply from 1.5 to 3.1 over the first 10 min, and further treatment (up to 4 h) gave only a slight increase to 3.8.[250]
In view of the fact that reverse oxidation of reduced GO has been observed by a number of researchers (see Refs [90][142][175][185][245][273][283]), it should be noted that the superposition of anodic oxidation onto cathodic reduction is possible and may be one of the reasons for the low degree of reduction. Even if decarboxylation occurs, the fraction of carboxyl groups is generally small, and their removal may not lead to a significant change in the C/O ratio. Rather, anodic oxidation at high potentials can increase the content of OFGs in the material, especially upon electrode polarity reversal: cathodic reduction can initiate the formation of new defects that are readily oxidized upon subsequent anodic polarization.
Along with anodic deposition, cathodic EPD of GO is also used. Its implementation requires reversal of the negative charge of GO sheets to a positive one. This is achieved by modifying the GO surface, for example, by adsorption of polyelectrolytes[351] or complexation with heavy metal ions such as Ni, Co, and Zn.[352-354] Quezada-Rentería et al.[262] achieved the charge reversal of GO sheets from negative (ζ-potential ≈ –40 mV at pH 6) to positive (ζ ≈ +5.2 mV) by adding 0.1 M CaCl2 due to specific adsorption of Са2+ complexes. The adsorption involves complexation with carboxylate ions, cation – π interactions, and cooperative cross-linking of sheets to give aggregates in which ion binding is enhanced.[262] The positively charged GO sheets acquire the ability to migrate and deposit on the cathode. GO itself is deposited quite effectively at cathodic reduction potentials. Probably, the additional involvement of the electrophoretic process contributes to more efficient delivery of GO to the electrode surface. In addition, positively charged GO particles can, owing to migration, approach the electrode even at potentials that have not yet reached the GO reduction potential. However, these advantages lose their significance when reduction is carried out under convection conditions.
The mass of ERGO produced by direct EC reduction of GO on a small-area electrode usually does not exceed a few milligrams. Scaling up this process is difficult and often results in a material with an insufficiently high degree of reduction.
As a solution, a method of mediator g-assisted EC reduction has recently been proposed, making it possible to obtain ERGO rather simply and efficiently.[175] The key distinction of this method is that the reduction of GO occurs not on the electrode, but in the bulk solution, where the reduced form of the mediator diffuses (Fig. 16).[175] The process is carried out at relatively low potentials corresponding to the reduction of the mediator, which avoids problems associated with water discharge on the electrode. The use of methylviologen (MV2+) as a mediator in an aqueous medium at a potential of –0.75 V made it possible to achieve substantial removal of OFGs and to obtain few-layer (up to 5 layers) ERGO with a record high C/O ratio (equal to 165 according to TGA data) for EC and other reduction methods. Despite the high degree of reduction, the resulting material is still not free from structural defects, which is apparently inevitable for any derivatives of GO.
![[{"id":"bj4a6A1xvE","type":"paragraph","data":{"text":"Scheme of methylviologen-mediated reduction of GO.<sup>175</sup> Copyright Elsevier."}}]](/storage/images/resized/3MlIYSbPKv3DXcUKm0a0sG5Ug9THv6GeomdTF0v7_xl.webp)
EC methods of graphene synthesis are not limited only to GO reduction. One of the common approaches is EC exfoliation of graphite, a direct top-down method based on the intercalation of electrolyte ions followed by exfoliation of graphene layers.[355-357] High voltage is applied to disrupt the graphite structure: from 15 V (low-voltage exfoliation) to 100 – 300 V (high-voltage exfoliation).[60] The products of low-voltage and high-voltage exfoliation without plasma formation are particles close in morphology to finely dispersed graphite. At the same time, plasma modes (high-voltage mode with a current density exceeding 20 A cm–2) lead to the formation of thin flexible graphene-like structures functionalized with various OFGs.[356]
As studies show, the process carried out under milder conditions can lead to surface modification of the carbon electrodes by a GO layer. Zeng et al.[54] used a combination of independent methods (SEM, TEM, Raman, XPS, IR) to observe the formation of OFGs on the surface of a graphite electrode upon potential cycling (2 – 5 cycles) at a scan rate of 50 mV s–1 in the range of 0.0 to 3.0 V in a 0.025 M aqueous PBS solution. In addition, CV of this electrode showed reversible electroactivity in the region of 0.0 V, which may be due to the formation of quinoid structures. The modification occurs through a combination of EC oxidation, gas intercalation, and mechanical exfoliation of graphite under mild aqueous conditions, resulting in the formation of a firmly attached nanoscale GO layer with a C/O ratio of 3.45 on the electrode surface. An analogous process for a GC electrode was reported by Tateishi et al.[326] Upon potentiostatic oxidation in 0.1 M Na2SO4 at potentials of +1.46 and +1.96 V (vs. Ag/AgCl) for 30 min, a graphite oxide layer about 20 nm thick is formed on the electrode surface. The surface of the sample is enriched in epoxy groups. The EC reduction at E = –1.1 V for 30 min led to the transformation of epoxy groups into C – H defects.
Among the EC methods of graphene synthesis, one can also mention EC delamination of CVD graphene: a technique for transferring graphene from a metal substrate by cathodic hydrogen evolution or anodic etching of the metal,[358] as well as hydrothermal cathodic reduction of organic compounds, in which hydrocarbons, carboxylic acids, or alcohols are used as precursors.[99] A systematic overview of EC synthesis methods for graphene-like materials can also be found in a monograph.[359]
* ERGO obtained in the potentiodynamic (CV) and potentiostatic (chronoamperometric) modes are compared. Numerical values of electrical conductivity are not provided in the cited work.[239] The conclusion about higher electrical conductivity was drawn on the basis of XPS data showing a higher content of sp2-hybridized carbon atoms in the sample obtained by the CV method, which is responsible for electrical conductivity.
** By organic solvents here are meant aprotic media (DMF, DMSO, acetonitrile, THF) — all those organic solvents in which the EC properties of GO were studied for comparison with aqueous media. In such media, pH is generally not measured or reported, but proton donating compounds (water, acids, alcohols, phenol, etc.) can be added to them to study the effect of protons.
4.5. Comparative analysis of graphene oxide reduction methods
Numerous studies show that any method of GO reduction leads to the formation of various defects in the RGO structure. The main defects include:[360][361]
(1) residual OFGs;
(2) incorporation of heteroatoms (e.g., nitrogen, sulfur) from the reducing agent or electrolyte into the carbon lattice;
(3) topological defects: vacancies, pores, and edges;
(4) disruption of sp2-hybridization (sp3-defects);
(5) Stone – Wales defects (formation of 5- and 7-membered rings).
The choice of GO reduction method determines not only the degree of OFG removal, but also the nature of the structural defects formed in the material. These defects play a decisive role in the performance characteristics of ERGO, since they introduce new properties, often undesirable, into the final material.[90]
It is generally recognized that thermal reduction of GO effectively removes surface groups with the release of CO2, which leads to the formation of pores and vacancies in the basal planes. This increases the proportion of edge regions and, consequently, the chemical reactivity of the material.[67] Chemical reduction, for example using hydrazine, is often accompanied by the incorporation of nitrogen into the carbon lattice, leading to surface functionalization. In general, chemical and thermal methods usually yield highly reactive materials with a high density of edge defects (vacancies or holes).
Conversely, EC reduction produces materials with a more ordered structure.[81][332][362] This method is characterized by high selectivity: in most cases, epoxy, phenolic, and carbonyl groups are effectively removed, whereas carboxyl groups are generally retained.[186] Moreover, EC reduction of GO proceeds significantly faster than thermal reduction and has a relatively low activation energy (less than 30 kJ mol–1 depending on the supporting electrolyte).[243]
Moreover, ERGO exhibits improved capacitive properties compared to the products of other reduction methods. Among other reasons, this may be caused by the intercalation of electrolyte ions between the graphene layers.[69][88][194][283] XPS detects the intercalation of a noticeable amount of potassium ions (up to ~ 2.5 at.%, maximum K/C ratio ≈ 1 : 8) into the ERGO structure.[363] This prevents re-stacking of the layers, providing a high accessible surface area, which apparently directly determines the high specific capacity of the material.[201][283] If the binding of supporting electrolyte cations in GO presumably occurs via carboxyl groups, then the high cation capacity of ERGO can be explained both by a large proportion of residual carboxyl groups and by the acidity of vinylogous moieties* formed as a result of keto – enol tautomerism.[363] Concurrently, a decrease in the amount of intercalated water is observed during EC reduction. For example, pristine dry GO contains 4.1 water molecules per 100 atoms, but this amount drops to 0.6 after reduction to ERGO with a C/O ratio of 3.8.
Direct comparison of the properties of RGO obtained in different studies is often incorrect due to substantial differences in the characteristics of parent GO. Therefore, the most objective studies are those in which different reduction methods are applied to an identical parent GO sample.
Báez et al.[364] performed such a comparison, having evaluated chemical, hydrothermal, EC, and thermal methods. The characteristics of the materials they obtained are summarized in Table 13[364][365].
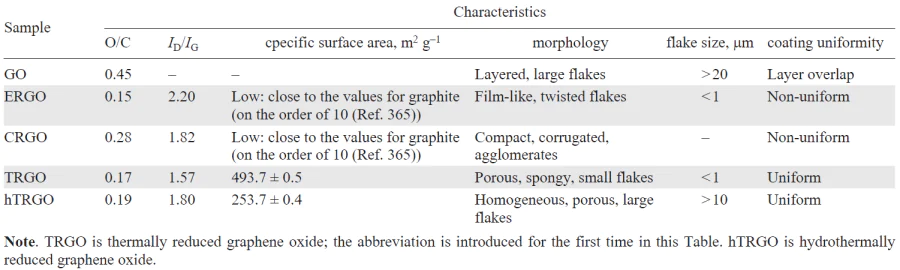
Tian et al.[269] showed that chemical reduction with hydrazine destroys the GO film on a copper substrate due to vigorous gas evolution; thermal treatment at 200°C was ineffective, and its intensification was technologically impractical. Only the EC method enabled the required degree of reduction to be achieved without damaging the structure. This is consistent with the data of Jarić et al.,[286] who emphasizes that, unlike chemical reduction, which leads to nitrogen incorporation and retention of many OFGs, the EC process introduces no foreign elements and ensures more complete removal of OFGs. This results in better conductivity, larger sp2-domain sizes, and higher EC activity of ERGO.
The choice of method, however, is dictated by the target properties of the final material. Thus, the most reduced sample prepared by thermal reduction (TRGO) (C/O = 23.3) showed the best performance as an electrode material compared to ERGO (C/O = 5.1) and CRGO (C/O = 2.9).[332] At the same time, in another study,[304] ERGO (C/O = 9.55) was recognized as more promising for biosensor applications than TRGO with a higher C/O ratio (16.02). The authors attributed this result to the selectivity of EC reduction, which removes epoxy, aldehyde, and peroxide groups, while retaining the carboxyl groups responsible for analyte immobilization.[304]
Quezada-Renteria et al.[91] compared the products of photochemical and EC reduction of GO and found that EC reduction under mild conditions results in the formation of sp3-defects and allows for the preferential reduction of carbonyl and carboxyl groups. In contrast, photochemical reduction produces a fragmented sp2-network with a high density of carbon vacancies, which was attributed to the selective removal of epoxy and hydroxyl groups.
For the most efficient reduction of GO, it is recommended to combine different methods, since each of them contributes to the elimination of certain types of defects.[91][193] The combined approach not only efficiently removes OFGs, but also improves the structure of the graphene network, which is reflected in a decrease in the ID/IG ratio compared to that of the chemically reduced material. As an example, preliminary reduction with ascorbic acid or N-acetylcysteine anodically shifts the subsequent reduction potential of GO by more than 0.5 V.[280] Such mild chemical treatment partially restores the sp2-carbon network and reduces carbonyl and epoxy groups, while increasing the hydroxyl group content.[190] In this case, the sequence of method application is fundamentally important. For example, when combining EC and photochemical reduction, EC pretreatment prevents the formation of carbon vacancies during subsequent irradiation. The opposite sequence accumulates both types of defects: carbon vacancies and sp3-defects.[91]
The above data indicate that the choice of the GO reduction method has no universal solution and depends on the target characteristics of the final material. Moreover, the properties of the product can vary significantly even for the same method, depending on the synthesis conditions and the parent GO characteristics. Consequently, claims about the absolute superiority of any approach are unjustified. The selection criterion should be the specific task, which determines the required balance between the reduction degree, the type of residual OFGs, the nature of structural defects, and the desired functional properties of RGO.
* A system of conjugated double bonds (–СН=СН–) that connects two functional groups
5. Applications of electrochemically reduced graphene oxide and methods for its integration into functional materials
The EC method for the RGO synthesis is unique in that it directly yields the final product as a film deposited on a conductive substrate, the electrode. This opens up two main application options: using the immobilized film directly on the substrate or using it after detachment. ERGO can be used as a stand-alone material or as a key component of composites, an aspect that significantly expands the range of its functional properties. The ability of graphene materials to interact with various compounds and metal nanoparticles (MNPs) through π – π interactions, owing to their sp2-conjugated structure plays an important role in composite formation.[329]
Although the removal of OFGs and restoration of the sp2-carbon network improve the electrical conductivity of ERGO, the material often retains a semiconducting character, as evidenced by a band gap of ~ 0.54 eV.[189][366] Various defects are responsible for the inability to attain the high conductivity of graphene. However, defects can be useful for EC applications, since they facilitate electron transfer from the graphene plane to the electrode.[367] An electrode modified with ERGO exhibits higher electron transfer rates compared to bare GC and graphite electrodes.[368] The kinetics of electron transfer in ERGO is influenced by morphology, defect density, and the presence of edge planes.[187][369]
It was shown[370-372] that the edges sites of the basal planes exhibit substantially higher EC activity than the basal plane itself. This is also confirmed in a study,[207] where vertically oriented ERGO structures on a GC electrode provided approximately 9-times faster electron transfer than the planar configuration, due to better edge contact with the electrode and less shielding.
Composites of ERGO with MNPs have great application potential. In these systems, ERGO can perform a protective function[334] or lead to synergistic enhancement of the catalytic and electrocatalytic properties of MNPs.[373] An important advantage of EC synthesis is that it yields graphene and its nanocomposites free from reducing agent and surfactant impurities, which often persist from chemical routes and can block active sites.[302] The synthesis of such nanocomposites, where both components are obtained via EC reduction of their precursors, can be carried out either in one step (co-reduction)[200][201] or sequentially.[197] During co-deposition, it is important to consider the charge of the precursors: the addition of positively charged metal ions (e.g., Cu2+, Ni2+, or Zn2+) can cause aggregation of GO sheets, presumably due to electrostatic cross-linking,[201] whereas anionic precursors [PtCl6]2 – , [AuCl4]–) [197][200] are fully compatible with GO in colloidal solutions.
Successful examples of this approach include the synthesis of a Pt/ERGO composite by successive electrodeposition of ERGO followed by electrodeposition of Pt NPs from an H2PtCl6 solution,[197] and the preparation of an Au/ERGO nanocomposite via one-step co-reduction of a precoated GO film and Au(III) ions from an HAuCl4 solution.[200]
A two-step EC method has been developed for the synthesis of three-dimensional porous ERGO-based composites with complex architecture.[199] First, a porous ERGO matrix is formed from a concentrated GO dispersion; then, a secondary electroactive material (polymer, MNPs, or metal oxide NPs) is deposited into its pores. Such structures combine high specific surface area, open porosity, and controllable composition, making them promising for supercapacitors, batteries, and sensors.
The synthesis of ERGO composites with conductive polymers, such as polyaniline (PANI)[167][309][374-376] and poly(3,4-ethylenedioxythiophene) (PEDOT)[377] represents a distinct line of research. The composites are synthesized by co-electrodeposition, combining anodic polymerization of the monomer and cathodic reduction of GO within a single voltammetric cycle or under alternating current electrolysis. The initial anodic polymerization is generally accompanied by co-deposition of GO flakes, which promotes more uniform distribution of the components in the formed composite material.[309] The resulting composites exhibit enhanced electrical conductivity and stability, finding applications in flexible electronics, supercapacitors, and chemical sensors.[378-380]
5.1. Sensors
ERGO is a promising material for the development of EC sensors that effectively combines the advantages of graphene and GO. Graphene possesses outstanding conductivity; however, its chemical inertness and hydrophobicity complicate its deposition on the electrode and subsequent immobilization of biological probes. Very few electroactive sites are available on the surface of pristine graphene, which limits the biosensor sensitivity.[278] At the same time, GO containing numerous OFGs is easily dispersed and deposited on an electrode surface, and also exhibits high reactivity; however, its low electrical conductivity limits its application in electrochemistry. ERGO, obtained by controlled EC reduction of GO, retains some OFGs necessary for functionalization, while restoring the conductive sp2-network of graphene.[136][266][308][358] The EC approach offers the important advantage of directly forming the ERGO layer on the electrode surface, which not only simplifies the modification process but also allows precise control of the material properties by varying the reduction parameters. The developed surface of ERGO provides a high density of bioreceptor immobilization, enhancing sensor sensitivity, while its chemical and mechanical stability ensure long-term reproducibility of measurements.[279] Moreover, ERGO shows a high electron transfer rate, exceeding that of GC and graphite electrodes.[381] Therefore, EC reduction is actively used in laboratory research for one-step, rapid, non-toxic, and cost-effective fabrication of ERGO-based sensors and electrodes.[128]
Besides chemical structure, the three-dimensional morphology of the material is crucial for sensor electrode performance.[252] Although EC reduction effectively removes oxygen and yields the ‘cleanest’ defective carbon material, it often produces an unfavourable dense morphology that encapsulates active sites, preventing large analyte molecules from reaching them.[364][382] Consequently, such ERGO films show lower sensitivity and higher detection limits than CRGO[382] and TRGO.[364] However, the ERGO morphology can be substantially improved by using the electrodeposition instead of the coating-reducing method. Electrodeposition facilitates the formation of vertically oriented graphene sheets with increased surface area and accessible, functionalized exposed edges, thereby boosting sensor performance.[252]
To improve sensor performance, functionalization of carbon electrode materials with heteroatoms is proposed. Nitrogen is considered to be one of the most effective dopants for graphene, owing to its similar atomic size and valence electron count. Incorporating nitrogen into the graphene structure can improve its electrical conductivity and stability, while also creating additional active sites on the surface.[383] In particular, an electrode modified with EC reduced nitrogen-containing GO was investigated for detecting the fungicide carbendazim.[384]
ERGO-based films have been extensively studied as platforms for the voltammetric determination of various substances.* Primary attention has been given to biomolecules and biomarkers, including the coenzyme NADH,[266][385] amino acids such as L-tryptophan,[298] L-tyrosine,[272][298] and phenylalanine;[386] important metabolites and neurotransmitters like ascorbic acid,[260][387] dopamine,[103][252][257][272] uric acid,[275] and glutathione;[388] nucleic acid components and ligands: DNA bases,[389] allopurinol;[390] bioactive compounds such as rutin[391] and taxifolin.[249] Beyond these, ERGO has been applied to detect other classes of analytes: hydrogen peroxide,[272] heavy metal ions,[136][301][392] antimony compounds,[316] natural bioactive substances (daphnetin,[317] sophoridine,[335] curcumin and its analogues,[393] caffeic acid,[394][395] and caffeine),[396] industrial chemicals and pollutants (furfural,[192] fenamiphos,[397] hydroquinone),[186] the synthetic dye pyrosine,[314] and pharmaceutical compounds such as isoniazid.[308] The use of ERGO in the electroanalysis of actinides has also been explored.[310] In addition, molecularly imprinted polymer (MIP) sensors based on ERGO are currently under development.[285]
Such a wide range of detectable analytes stems from the heterogeneous and multifunctional nature of the ERGO surface, which combines residual OFGs capable of hydrogen bonding and electrostatic interactions, extensive sp2-carbon domains that enable π – π stacking with aromatic molecules, and structural defects along with active edge sites that act as catalytic centres for electron transfer. This combination of diverse adsorption and interaction sites allows ERGO to effectively bind and detect both polar and aromatic compounds, making it a versatile platform for EC detection.
The versatility of ERGO-based sensors is an advantage; however, their selectivity is also of key importance. In most studies, analyses are performed in the presence of several model interfering substances, and the selectivity of the electrodes is confirmed experimentally. For instance, the determination of pyrosine (E124) proceeded selectively in the presence of the interfering dyes brilliant blue (E133) and quinoline yellow (E104).[314] ERGO-based EC sensors also exhibit selectivity toward different isomers, including hydroquinone and pyrocatechol.[186] Nevertheless, the limited set of interfering components tested does not rule out interference from other unaccounted substances in real samples.
To improve the performance of ERGO-based sensors, ERGO is combined with other carbon materials, such as carbon nanotubes[398] or graphene.[278] For instance, an ERGO – graphene double-layer electrode delivers 42% and 36.7% higher current than electrodes modified with pure ERGO and pure graphene, respectively, which is attributable to the combination of high conductivity of graphene and numerous electroactive sites present in the ERGO layer.[278] Overall, the use of carbon nanomaterials as working electrode materials enhances the analytical signal in EC systems.[399] Their main advantage in sensor systems is that they serve as effective substrates for analyte adsorption. Adsorption provides preconcentration of the target substance on the electrode surface and creates conditions for subsequent electrocatalysis. In the absence of adsorption interactions, these materials simply act as highly conductive matrices with an extensive surface.[399]
The synergy between ERGO and MNPs leads to a significant improvement in sensing performance.[373] Among such systems, composites with Au NPs are the most thoroughly studied and effective. While ERGO alone shows weak EC activity toward hydrogen peroxide,[400] its combination with Au NPs results in a sharp increase in sensitivity and the appearance of an H2O2 reduction peak at –0.2 V. In this system, ERGO provides numerous adsorption sites for H2O2 through defects and OFGs, while the Au NPs facilitate electron transport.[373] This line of research is being extended by designing ERGO nanocomposites with Au[290][321][400][401] and Ag (Ref. 401) NPs doped with additional components to enhance sensitivity toward H2O2.
Au NPs/ERGO nanocomposites have also been successfully applied for the selective simultaneous determination of ascorbic acid, dopamine, and uric acid (Fig. 17).[245][274] In addition to the ERGO properties, the size and morphology of the Au NPs also significantly influence the performance of electrode materials.[402] These sensors exhibit high selectivity and stable signals even in the presence of species typical of clinical samples, including ions (Na+, K+, Ca2+, Cl–) and organic compounds (glucose, amino acids).[402] The application of Au NPs/ERGO nanocomposites has been extended to the detection of nitric oxide (NO)[403] as well as to nitrogenous bases and DNA oligonucleotides.[404]
![[{"id":"o8_xv02bFr","type":"paragraph","data":{"text":"(<i>a</i>) SEM image of the Au/ERGO composite; (<i>b</i>) DPV curves for a mixture of ascorbic acid (AA, 1.0 mM), dopamine (DA, 0.1 mM), and uric acid (UA, 0.1 mM) at a bare GCE, at an ERGO-modified electrode (ERGO/GCE), and at an electrode modified with the Au/ERGO composite (ERGO – Au/GCE). The inset shows an enlarged fragment of the voltammogram for the bare GCE. Conditions: H<sub>2</sub>O/0.067 М PBS, pH 6.98. DPV parameters: υ = 4 mV s<sup>–1</sup>, pulse amplitude of 50 mV, pulse duration of 20 ms.<sup>245</sup> Copyright Wiley-VCH."}}]](/storage/images/resized/PPzTwflYsDq5tE4xTJTncHhVgqAUdG0tsjYd6pEH_xl.webp)
Apart from noble metals, composites of ERGO with metal oxide and hydroxide NPs are also of considerable interest. These include CeO2 for dopamine detection,[405] nickel cobalt hydroxides for hydrogen peroxide analysis,[251] ruthenium oxide hexacyanoferrate for ranitidine detection,[406] and Ni2O3 – NiO for paracetamol.[381] Composites with lanthanide hexacyanoferrates (lutetium [242] and neodymium)[297] have also been investigated for paracetamol and salicylic acid detection, respectively.
In addition, ERGO-based sensors are readily modified with organic compounds, such as diazonium salts for paracetamol detection,[289] or cyclodextrin for the analysis of the fungicide carbendazim.[407] Owing to π – π stacking between the graphene matrix and aromatic moieties, ERGO serves as an effective adsorbent for dyes. These systems may hold promise for the development of dye-sensitized biosensors.[408]
ERGO serves as an effective platform for the immobilization of biomolecules, which is particularly important for the development of enzyme-based sensors. Its advantage lies in the ability to enable direct electron transfer between the enzyme active site and the electrode without the need for additional mediators.[105] One of the most extensively studied enzymes is glucose oxidase. It is immobilized on ERGO either directly[253] or through polymer interlayers, such as poly-N-succinimidyl acrylate.[105] To improve glucose detection efficiency, multicomponent systems have been developed, including ERGO/MWCNTs/glucose oxidase/Nafion[296] and AuPd/ERGO/glucose oxidase.[409] Horseradish peroxidase has also been successfully immobilized on ERGO, providing highly sensitive sensors for hydrogen peroxide determination.[188] An electrode prepared by immobilizing laccase on ERGO with residual hydroxyl groups catalyzes the direct reduction of oxygen to water (without forming reactive oxygen species) at potentials around +0.6 V.[303]
ERGO-based electrodes are modified with single-stranded DNA.[278][287][410][411] DNA is adsorbed on ERGO via hydrophobic interactions, π – π stacking with the graphene network, and hydrogen bonding with residual OFGs. Upon contact with complementary target DNA, hybridization takes place, forming double-stranded DNA, which leads to a change in the EC signal of the sensor, particularly its impedance.[287][410]
Recently, sensors targeting cancer biomarkers have been actively developed. For example, materials based on Au NPs/ERGO and peptide nucleic acids have been designed for the detection of double-stranded methylated MGMT gene,[279]and a gold electrode modified with ERGO and an aptamer has been developed for the determination of matrix metalloproteinase-2 (MMP-2).[288]
The main analytical performance parameters of ERGO-based materials, such as linear concentration range, detection limit, and sensitivity, are summarized in Table 14[412][413]. Depending on the analyte nature and the analytical method employed, the detection limit can reach femtomolar (fM) concentrations, as demonstrated for DNA molecules.[411] The maximum sensitivity for the selected analytes is 272 µA µM–1 cm–2 (for daphnetin).[317]
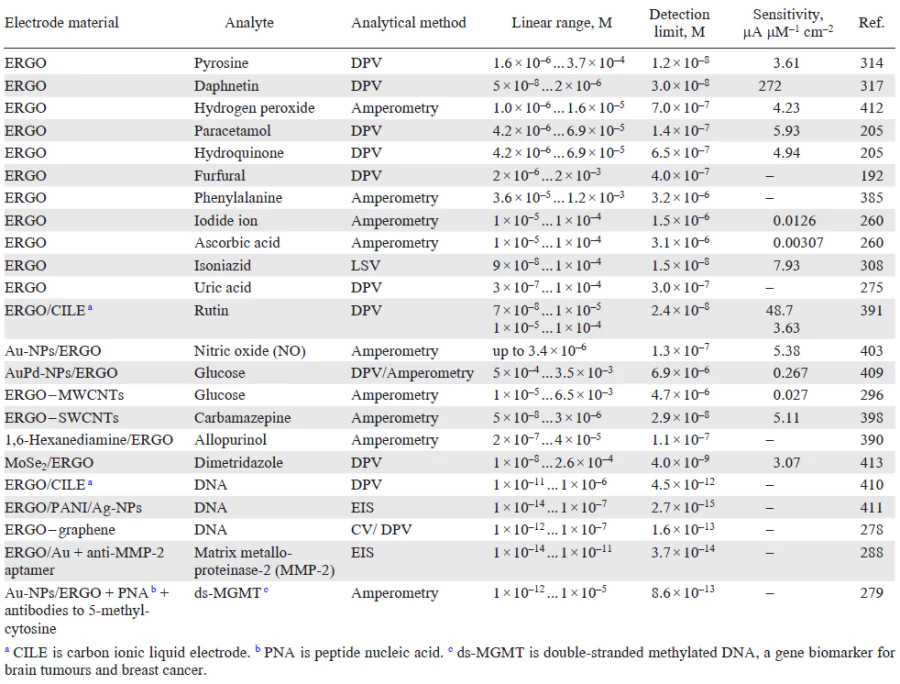
ERGO continues to be among the most sought-after materials in the field of EC sensors. The number and rate of publications in this field make it practically impossible to cover all studies comprehensively. In this review, we have attempted to systematize the main research avenues, highlighting the broad applicability of ERGO. It should be noted that oxygenated graphene derivatives with varying degrees of reduction, often obtained without EC pretreatment, are often frequently used as electrode materials. As studies show, depending on the degree of reduction, GO can exhibit considerable EC activity not only in the cathodic but also in the anodic region. This factor should be considered in the development of stable and reproducible sensor platforms.[306][414]
* ERGO was successfully applied for the detection of all the listed analytes, unless otherwise indicated
5.2. Supercapacitors
Capacitors (supercapacitors) are one of the most promising applications of ERGO.
In general, the material components of supercapacitors can be divided into three main categories:[8] (1) carbon materials, such as activated carbon, carbon nanotubes, graphene, GO, RGO, etc.;[415][416] (2) conducting polymers, such as PANI and polypyrrole;[417] (3) transition metal oxides and hydroxides, e.g., RuO2, NiO, MnO2, CuO, etc.[418]
The exceptionally high electrical conductivity (~ 1000 S cm−1) and large theoretical specific surface area (~ 2600 m2 g−1) of graphene [419][420] make it potentially one of the best materials for supercapacitor electrodes. However, in practice, these characteristics considerably decrease due to the strong tendency of graphene sheets to aggregate and undergo restacking through π – π and van der Waals interactions. Thus, a key task in the design of supercapacitor electrodes is to develop strategies for preventing the restacking of ERGO sheets, thereby increasing the specific surface area.
GO or RGO layers exhibit high capacitive performance provided a balance is maintained between the OFG content and electrical conductivity.[333] GO has a high OFG content, which promotes pseudocapacitance, but simultaneously decreases the conductivity. Conversely, ERGO has a low OFG content and high conductivity, but yet contains structural defects that also affect ion adsorption. Optimizing the degree of GO reduction makes it possible to retain a certain fraction of OFGs, which not only participate in surface redox reactions, boosting pseudocapacitance, but also prevent aggregation and restacking of graphene layers, thereby preserving adequate electronic conductivity.[186][248][285][318][421]
Thus, the specific capacitance of ERGO is determined not by the absolute degree of reduction, but by an optimal balance between the amount of restored sp2-carbon, the quantity and type of residual OFGs, the morphology, and the size of sp2-domains.[186]
Tateishi et al.[326] suggested that C – H groups may play a significant role in capacitance formation. According to the authors, these defects contribute to pseudocapacitance through reversible faradaic reactions and also serve as an indicator of the high conductivity of the surrounding carbon matrix.
Electrodeposition is a simple, rapid, environmentally friendly, and cost-effective approach for tuning the porosity and morphology of the final electrode material to achieve optimal EC performance. Moreover, this method deposits ERGO or its composite directly onto the current collector, avoiding the use of binders and additives that introduce extra resistance into the electrode.[8]
A proposed strategy for preventing the restacking of graphene layers is the combination of ERGO with porous materials such as biochar.[166] High ERGO conductivity combined with the three-dimensional biochar structure, which prevents aggregation, forms an optimal system. Composite of this type was obtained by GO EPD followed by EC reduction to ERGO on the biochar surface.[166] Similar composites have been prepared with carbon fibres,[422] carbon felt,[198] and carbon nanotubes.[312][423] Metal foams, mainly based on nickel, have also been used as electrodes.[8][248][320] ERGO deposited on the pore walls increases the electrode surface area and contributes to the electric double-layer capacitance. Additional capacitance enhancement is achieved by immobilizing MNPs (e.g., gold)[373] on the ERGO surface or by synthesizing composites with electropolymerized polymers such as PANI or polypyrrole.[199][268][309][311]
Table 15[424-429] lists the specific capacitances of electrodes based on ERGO and its composites. Analysis of the data indicates that the highest values are achieved with three-component systems, where ERGO serves as a highly conductive carbon matrix, metal oxides and hydroxides act as pseudocapacitance sources, and metal foam provides a structuring scaffold.
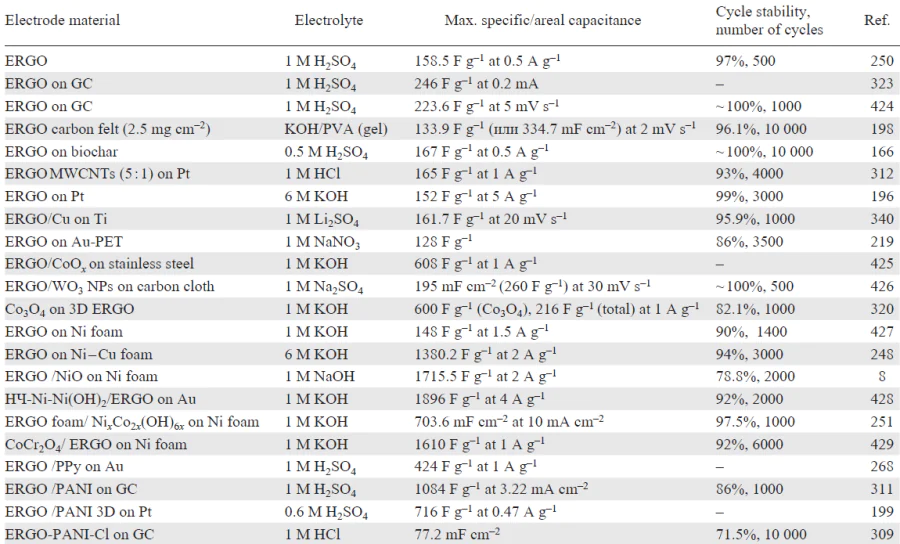
5.3. Electrocatalysts
ERGO is widely investigated as a support for various electrocatalytic materials in a number of reactions. For such applications, the balance between the residual OFG content and the electrical conductivity of the material is also critically important, requiring rational control over the degree of ERGO reduction. In this context, OFGs play a key role in enhancing support – metal interactions and stabilizing the catalysts.[273] Moderately reduced ERGO offers an ideal platform for immobilizing MNPs, ensuring high dispersion, stability, and catalytic activity, while high conductivity allows the material to simultaneously function as an efficient current collector.[273][430] Owing to these benefits, ERGO-based catalysts exhibit improved activity compared to carbon black-based catalysts,[273] as well as high tolerance to methanol, making ERGO a promising support for MNPs, particularly Pt.[197][284][431]
Graphitic materials, including graphene-based ones, are widely recognized to exhibit low intrinsic catalytic activity toward the hydrogen evolution reaction (HER). However, it has been shown that in combination with a catalytically active metal such as nickel, ERGO acts not only as a conductive support but also as a direct participant in the catalytic process.[430] The proposed mechanism involves the following steps: (1) discharge of water molecules on the Ni surface to give adsorbed hydrogen Hads; (2) migration of Hads atoms from the Ni surface to the adjacent ERGO surface; (3) fast recombination of two Hads atoms on the ERGO surface to form an Н2 molecule. For this reaction to proceed efficiently, structural disorder and residual OFGs in ERGO are required to enable the basal plane to sorb hydrogen atoms.[430]
Significantly more studies have focused on the application of ERGO in the electrocatalysis of the oxygen reduction reaction (ORR). High electrocatalytic activity has been reported for multicomponent ERGO-based systems, such as Pd-Mn2O3/ERGO,[431] AgCo@polyethylene glycol/ERGO,[329] and FePc/ERGO (Pc is phthalocyanine).[331] The reaction predominantly proceeds via a four-electron pathway with minimal formation of peroxide intermediates (HO2–). Moreover, the catalysts show better stability and methanol tolerance than commercial Pt/C (20 wt.%).
The possibility of using pristine ERGO as a catalyst for ORR in alkaline media has also been demonstrated.[194][284] The catalytic activity of ERGO stems from the quinone moieties on its surface. The adsorption and activation of oxygen molecules proceed via a redox mechanism involving the quinone/hydroquinone pair. EC reduction of the quinone moiety yields a semiquinone radical or hydroquinone, which can then adsorb oxygen and facilitate its reduction. However, the electronic structure of the quinone moiety does not promote complete O – O bond scission, leading to a preferential two-electron pathway with the formation of peroxide ions in alkaline media.[194]
Beyond HER and ORR, ERGO-based materials are considered a promising component of electrocatalysts for several other processes, including the reduction of NO3– to NH3,[334][432] the reduction of H2O2,[373][400][401] CO2 reduction,[433][434] alcohol oxidation,[273][435] and the oxygen evolution reaction.[436][437]
5.4. Anticorrosion coatings
The chemical inertness, gas impermeability, mechanical strength, and thinness of graphene make it a promising material for protective coatings.[438] Although the high electrical conductivity of graphene is generally an advantage, it is undesirable for anticorrosion applications. However, a material with the required barrier properties can be obtained by EC reduction of GO.
The anticorrosion properties of GO films deposited on metals (copper, carbon steel) by EPD have been investigated.[344][350] However, such films actually led to an increase in corrosion currents, which was attributed to the presence of defects in the resulting material.
In contrast to this approach and to thermal and chemical reduction, EC reduction avoids the formation of vacancies in the basal planes of the material during OFG removal, which improves its anticorrosion properties.[89][98][262][324][439] Furthermore, the EC approach enables the production of RGO with a low density of conductive sp2-domains by performing the reduction of GO in an acidic medium (pH = 2), where hydrogenation takes place concurrently with the removal of OFGs.[262] The resulting film exhibits high hydrophobicity and low conductivity, which underlies its effectiveness as an anticorrosion barrier.
The anticorrosion properties of ERGO films have been confirmed for various metals. Such a coating decreased the corrosion current of carbon steel from 11.83 to 4.14 mA cm–2, increased the charge transfer resistance from 84 to 406 Ω, and caused an anodic shift of the corrosion potential from –0.72 to –0.61 V.[262] A systematic study on stainless steel, copper, and aluminium in the temperature range of 20 – 50°C demonstrated protective efficiencies of 95.4% for steel, 65 – 76% for copper, and 63 – 68% for aluminium.[263] The protection mechanisms differed: for steel, the protection was governed by a barrier effect linked to higher corrosion activation energy, whereas for copper and aluminium, it was governed by an adsorption-blocking mechanism due to the passivation of active surface sites.[263]
To further improve the performance, methods for the chemical modification of ERGO films are being developed, for example, by increasing hydrophobicity through covalent attachment of alkyne chains.[88] At potentials more positive than +0.9 V, EC decarboxylation of 4-pentynoate occurs, generating a reactive carbon radical that selectively binds to the sp2-domains of ERGO.[440] According to the authors, the EC oxidation process may be accompanied by the removal of residual OFGs, particularly carboxyl groups,[347][348] which contributes to higher film hydrophobicity.
5.5. Other applications of electrochemically reduced graphene oxide
Ohmic contact. Metal-semiconductor junctions are key elements for many technologies, including silicon-based devices.[441-443] High resistance at the metal – semiconductor interface severely limits the performance of electronic devices. This problem can be solved by forming ohmic contacts that provide a linear (non-rectifying) connection between the materials. A low-resistance ohmic contact between platinum and silicon was achieved by depositing an ultrathin* ERGO layer onto the silicon surface.[264] The conversion of GO to ERGO transformed the contact from rectifying (diode-type) to ohmic, and its specific contact resistance dropped to extremely low values (< 4 × 10⁻⁶ Ω cm2). The ERGO layer eliminates Fermi level pinning, which underlies the high barrier and high resistance at the metal–semiconductor interface. Moreover, ERGO acts as a protective coating, preventing oxidation of the silicon surface.
Interconnections. Copper is a highly popular material for interconnections. However, the rapid advancement of microelectronics requires more conductive materials. An ERGO – Cu bilayer composite was developed and exhibited a 4.5% decrease in resistivity compared to pure copper.[269]
Hydrogen storage. ERGO shows promise for EC hydrogen sorption due to its well-developed porosity, low surface OFG content, and high proportion of unsaturated carbon atoms.[444] This process can be conducted at room temperature and atmospheric pressure through EC water splitting in either alkaline or acidic solutions.[445][446] Studies show that the generated atomic hydrogen is intercalated primarily into the graphene interlayer sheets, while only a minor amount adsorbs on the surface.[447] Consequently, the hydrogen storage capacity is rather determined by the interlayer spacing than by the specific surface area. However, the use of ERGO for hydrogen storage requires further clarification, as some studies suggest that hydrogenation may take place during the combined EC reduction of GO and water splitting.[90]
Strain sensors. ERGO is a promising material for high-sensitivity strain sensors, owing to its flexibility, reversible deformability, and ability to change resistance under mechanical stress through the rearrangement of conductive pathways between nanolayers. ERGO-based strain sensors demonstrate a gauge factor of up to ~ 3.7 (60% higher than that of metallic analogues), fast response (~ 1.1 s) and recovery (~ 0.92 s) times, cyclic resistance, and good compatibility with electronic systems owing to low resistance (~ 100 Ω).[184]
Material for solar cells. ERGO is a promising material for high-efficiency solar cells, serving, in particular, as a transparent catalytic counter-electrode in dye-sensitized solar cells with a cobalt-based redox mediator, Co(bpy)32+/3+ (Ref. 271). A solar cell with this transparent counter-electrode achieves a power conversion efficiency of 5.07%, which is not only higher than that of a CRGO-based cell (3.94%) but also comparable to that of a conventional Pt electrode (5.10%).
Materials for redox flow batteries. The applicability of ERGO as a tunable electrocatalyst for vanadium redox flow batteries has been reported.[322] The main active sites responsible for accelerating the VO2+/VO2+ and V3+/V2+ reactions were identified as carbonyl groups, rather than epoxy or hydroxyl groups. Modification of carbon felt with ERGO of optimal OFG composition decreased the polarization resistance and increased the energy efficiency to 82%, confirming the practical value of ERGO as a highly efficient and tunable catalytic coating for energy storage.
Membranes for fuel cells. ERGO is also regarded as a promising material for proton exchange membranes in fuel cells.[157][189] During the EC reduction of GO, the degree of oxygenation decreases, which is accompanied by a shrinkage in interlayer spacing and rapid loss of interlayer water. This leads to a sharp decrease (more than 1000-fold) in the Н2О diffusion coefficient, due to both a reduced water sorption capacity and an increased activation energy for water transport as the water content in the channels declines. In contrast to water diffusion, proton diffusion is largely preserved even upon extensive reduction of the material, owing to the low energy barrier for proton transport via the Grotthuss mechanism[448] between residual OFGs. This difference in behaviour yields a high ideal** H+/Н2О selectivity, which may be as high as 1400 according to the literature.[189] ERGO films exhibit proton diffusion coefficients (~ 10–11 m2 s–1) comparable to those of the commercial Nafion membrane, while having orders of magnitude higher H+/Н2О selectivity. These characteristics position ERGO as promising candidates for non-polymeric proton exchange membranes in fuel cells and electrolyzers.
The potential applications of ERGO are not limited to those listed above, and new areas of use continue to emerge.
* The layer is believed to be monomolecular. The authors do not supply thickness data, merely stating that the layer is virtually undetectable by SEM and AFM
** Ideal selectivity is the ratio of diffusion coefficients measured for each component separately, rather than in a mixture
6. Conclusion
Currently, the EC reduction of GO is attracting considerable research attention. The target product, ERGO, is most often formed directly on the electrode surface as a film coating, by either reduction of pre-deposited GO or electrodeposition from a GO dispersion. The process simplicity makes EC reduction an effective tool for modifying various types of surfaces, including both conductive and dielectric substrates. The applications of such films span sensing, EC energy storage, and catalysis.
Direct EC reduction of GO on an electrode typically yields a C/O ratio close to 10. Meanwhile, for many practical applications, the decisive factor for ERGO is not so much a high degree of reduction as an optimal balance between the residual OFG content and the electrical conductivity. In this context, the EC method offers a significant advantage, namely that it permits precise control of the GO reduction degree by varying the process parameters: potential, current density, and treatment time. Although EC approaches are primarilyused to form thin-film coatings, recent advances in mediated EC synthesis have broadened their scope to the scalable production of graphene-like materials. The large lateral dimensions of GO sheets, their limited solubility in the media studied, and the decreased solubility of the reduction product (ERGO) determine diffusion limitations during GO reduction, which are the cause of low currents. Meanwhile, mediated reduction currents are an order of magnitude higher, which enables the processing of large amounts of GO and yields a product with unprecedentedly high C/O ratios (~165).
A key theoretical issue is the absence of a universally accepted mechanism for the reduction process. The factors determining the reduction potential remain debatable. Some studies point to the decisive role of the OFGs in GO, while others emphasize the availability of protons in the reaction zone. Probably, an adequate description of the EC behaviour of GO requires taking all these factors into account. At present, no single proposed mechanism for the EC reduction of GO can be identified as uniquely correct, because the experimental results from different research groups do not conform to a unified picture. This leads to unpredictability of the structure and properties of the resulting product. The available data allow only general trends to be identified, whereas exact prediction is beyond reach. The primary cause of this situation is the absence of standardization of the initial GO. Nevertheless, rapid advances in GO structural characterization raise hopes that a consensus will be reached on this issue in the near future.
7. List of abbreviations and symbols
AFM — atomic force microscopy,
bpy — 2,2'-bipyridine,
СNT — carbon nanotube,
CRGO — chemically reduced graphene oxide,
CV — cyclic voltammetry,
CVD — chemical vapour deposition,
DPV — differential pulse voltammetry,
EC — electrochemical,
EDХ — energy-dispersive X-ray spectroscopy,
EIS — electrochemical impedance spectroscopy,
EPD — electrophoretic deposition,
ERGO — electrochemically reduced graphene oxide,
FTO — fluorine-doped tin oxide,
GC — glassy carbon,
GO — graphene oxide,
HER — hydrogen evolution reactions,
HRGO — hydrothermally reduced graphene oxide,
IR — infrared spectroscopy,
ITO — indium tin oxide,
LSV — linear sweep voltammetry,
MAS NMR — magic angle spinning NMR,
MNPs — metal nanoparticles,
MWCNT — multi-walled carbon nanotubes,
OFG — oxygen-containing functional group,
ORR — oxygen reduction reaction,
PANI — polyaniline,
PANI-Сl — polyaniline doped with chloride ions,
PBS — phosphate buffer solution,
PET — polyethylene terephthalate,
PPy — polypyrrole,
PVA — polyvinyl alcohol,
PXRD — powder X-ray diffraction,
Raman — Raman spectroscopy,
RGO — reduced graphene oxide,
SCE — saturated calomel electrode,
SEM — scanning electron microscopy,
STM — scanning tunnelling microscopy,
SWCNT — single-walled carbon nanotube,
TEM — transmission electron microscopy,
TGA — thermogravimetric analysis,
TRGO — thermally reduced graphene oxide,
XPS — X-ray photoelectron spectroscopy.
References